
Petrochemical Engineering Financial Model
This 20-Year, 3-Statement Excel Petrochemical Engineering Financial Model for a Petrochemical Engineering Company includes revenue streams from Specialty Chemical Manufacturing, Waste-to-Fuel Conversion, Consulting & Process Optimization etc. Cost structures, Discounted Cash Flow (DCF) with Terminal Value, Sensitivity Analysis, WACC, and financial statements to forecast the financial health of your Petrochemical Sales.
Financial Model for a Petrochemical Engineering Company
This very extensive 20 Year Petrochemical Engineering Company Model involves detailed revenue projections, cost structures, capital expenditures, and financing needs. This model provides a thorough understanding of the financial viability, profitability, and cash flow position of your business. Includes: 20x Income Statements, Cash Flow Statements, Balance Sheets, CAPEX sheets, OPEX Sheets, Statement Summary Sheets, and Revenue Forecasting Charts with the specified revenue streams, BEA charts, sales summary charts, employee salary tabs and expenses sheets. 140 Spreadsheets in 1 Excel Workbook giving a calculation of profitability for your Petrochemical Engineering Company.
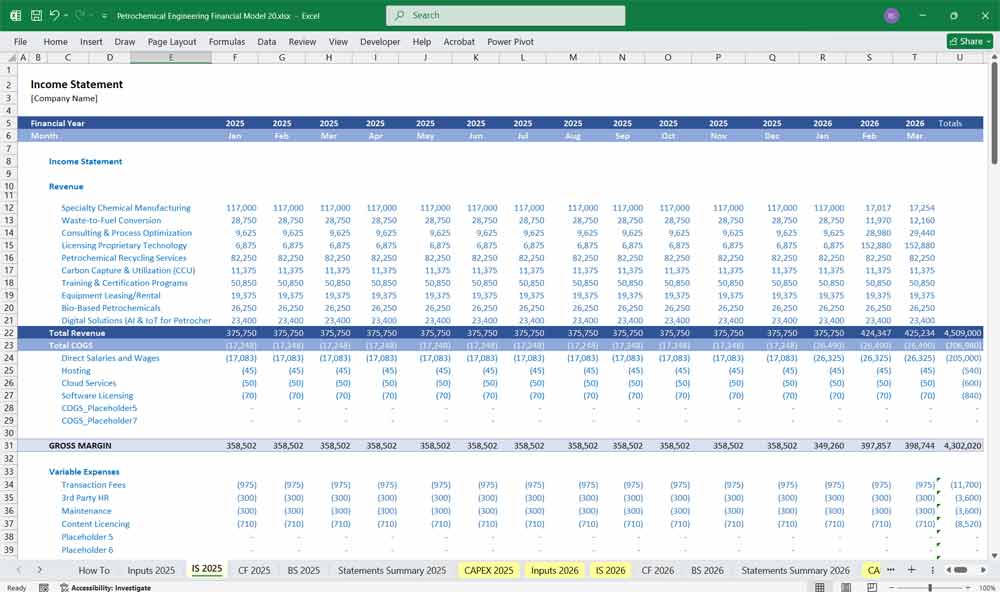
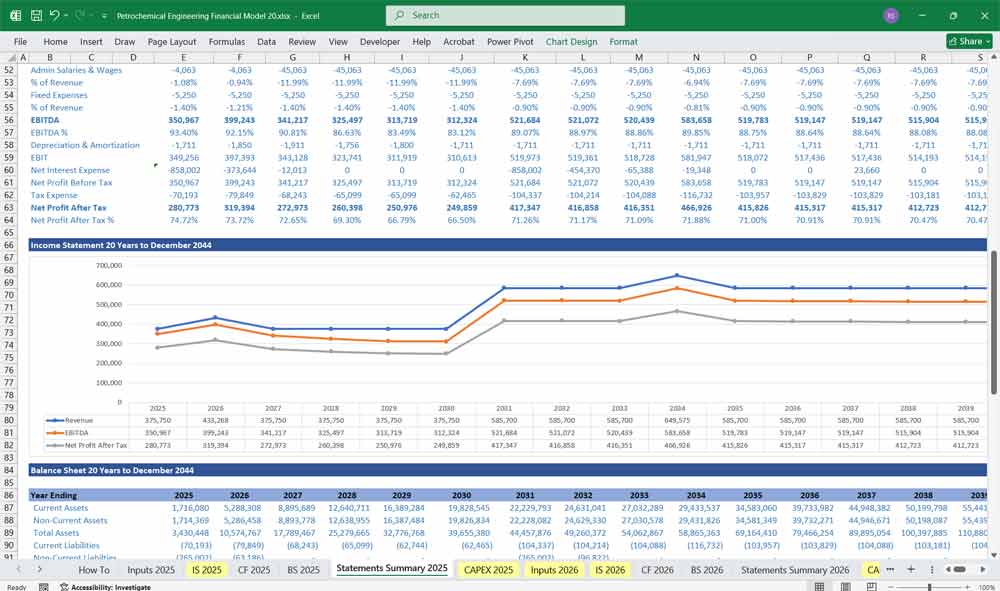
Income Statement (Profit & Loss Statement)
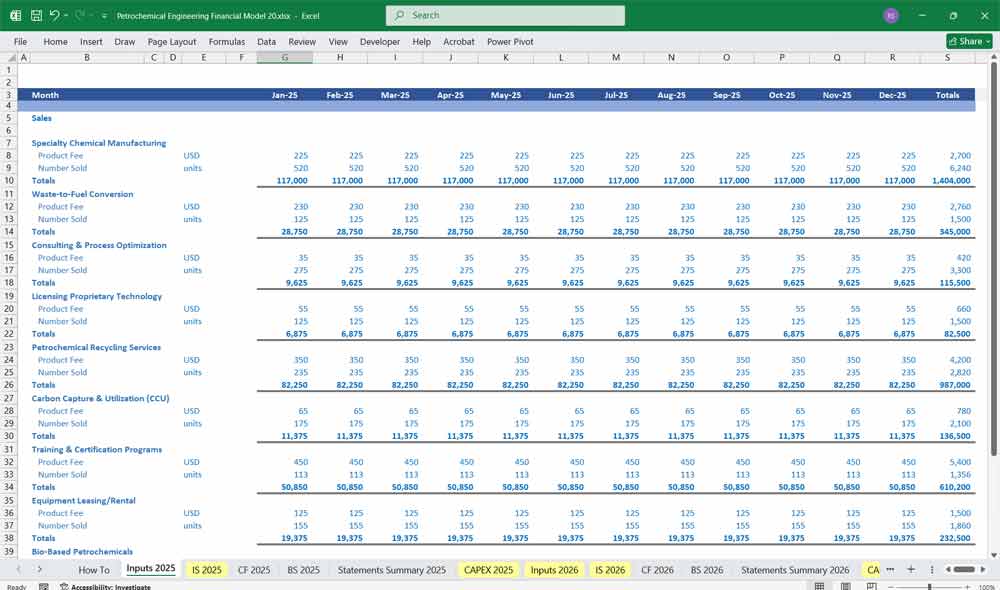
A. Revenue
Product Sales Revenue
Ethylene, Propylene, Polyethylene, Methanol, etc.
Based on volume (metric tons) × average selling price (ASP)
Engineering/Service Contracts
Lump sum or milestone-based payments
By-product and Waste Sales
Trading Revenue (if any)
B. Cost of Goods Sold (COGS)
Raw Material Costs
Naphtha, Natural Gas, Crude Oil fractions
Utilities
Steam, electricity, water usage
Labor (Production Only)
Maintenance and Repairs
Depreciation (Production-related assets)
→ Gross Profit = Revenue – COGS
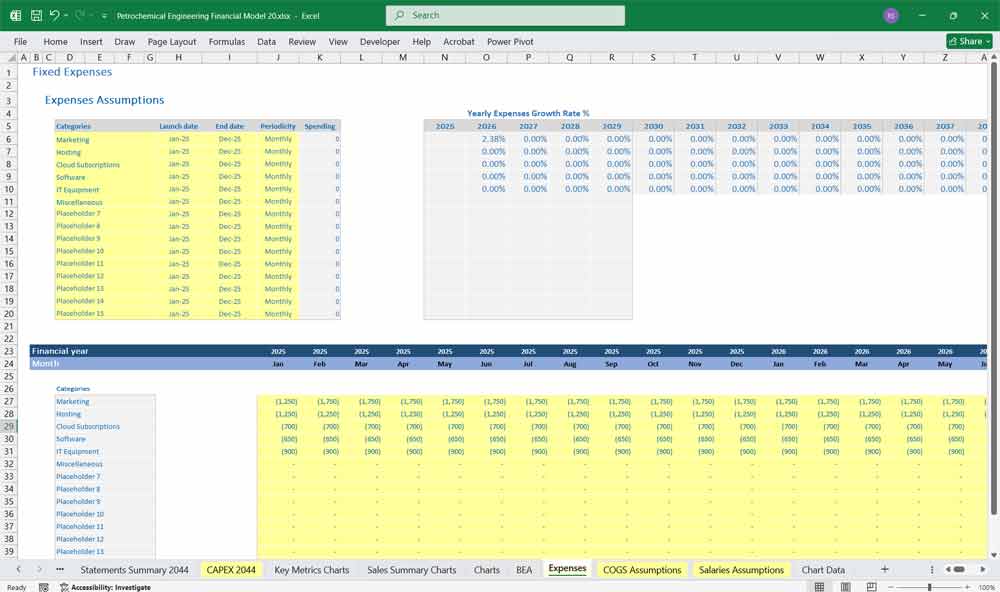
C. Operating Expenses (OPEX)
Selling, General & Administrative (SG&A)
Marketing, management salaries, legal, insurance
R&D Costs
Process innovation and catalyst development
Other Operating Expenses
Travel, audit, environmental compliance
Depreciation & Amortization (non-production)
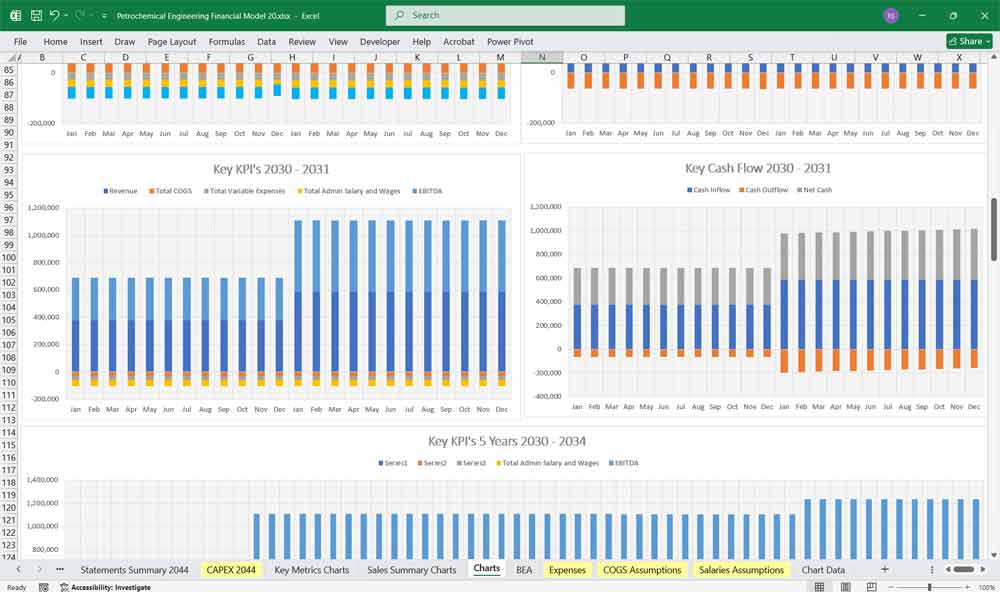
→ EBITDA = Gross Profit – Operating Expenses (excl. D&A)
→ EBIT = EBITDA – Depreciation & Amortization
D. Other Income/Expenses
Interest Income / Expense
Exchange Rate Gains/Losses
Gains/Losses on Asset Sales
E. Taxes
Effective tax rate based on jurisdiction and incentives
F. Net Income
→ Net Income = EBIT – Interest – Taxes
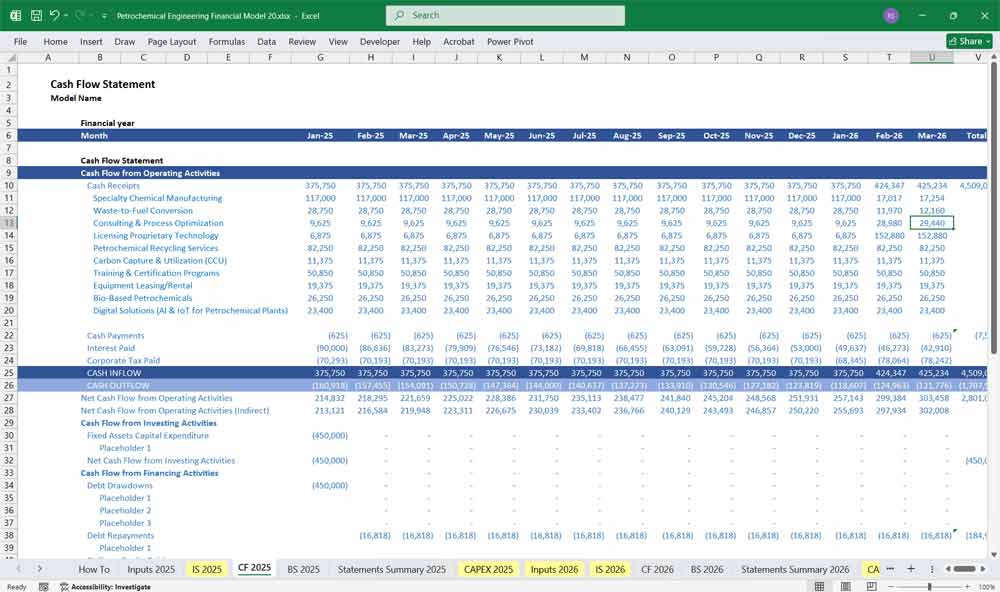
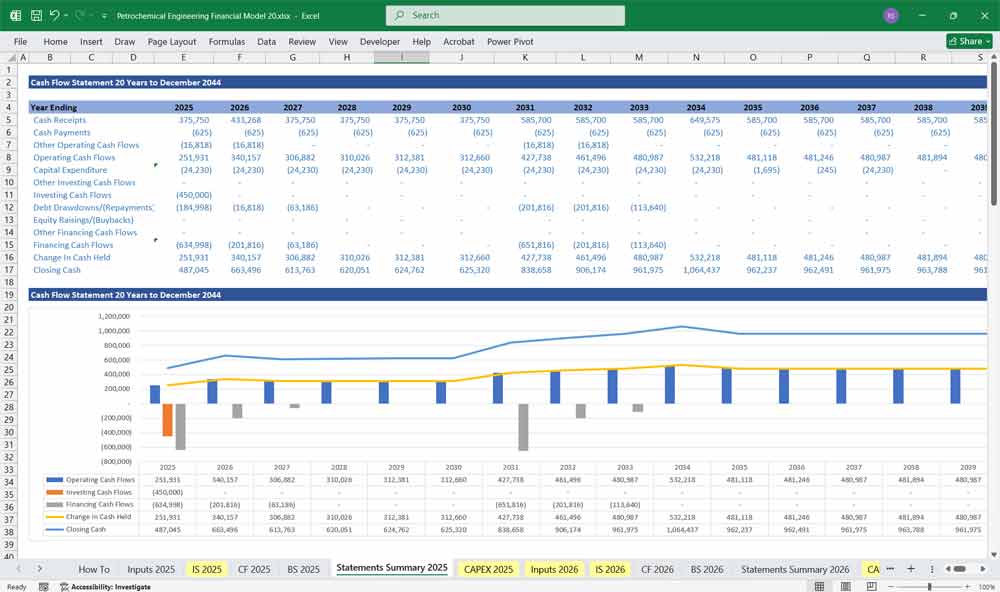
Petrochemical Engineering Company Cash Flow Statement
Organized into three major categories:
A. Cash Flow from Operating Activities
Net Income
Adjustments for Non-Cash Items
Depreciation & Amortization
Provision for environmental liabilities
Changes in Working Capital
Accounts Receivable
Inventory (raw materials, WIP, finished goods)
Accounts Payable
Prepaid Expenses and Accrued Liabilities
Deferred Taxes
→ Net Cash from Operating Activities
B. Cash Flow from Investing Activities
Capital Expenditures (CapEx)
Plant expansions
Equipment upgrades
Storage tanks and pipelines
Asset Sales
Sale of old equipment or non-core assets
Investments in JVs or New Projects
Intangible Asset Investments
Licenses, patents, technical know-how
→ Net Cash from Investing Activities
C. Cash Flow from Financing Activities
Debt Issuance / Repayment
Equity Issuance / Buybacks
Dividend Payments
Interest Paid
Lease Payments (if not part of OpEx)
→ Net Cash from Financing Activities
D. Net Cash Flow
= Operating + Investing + Financing Activities
E. Beginning and Ending Cash Balances
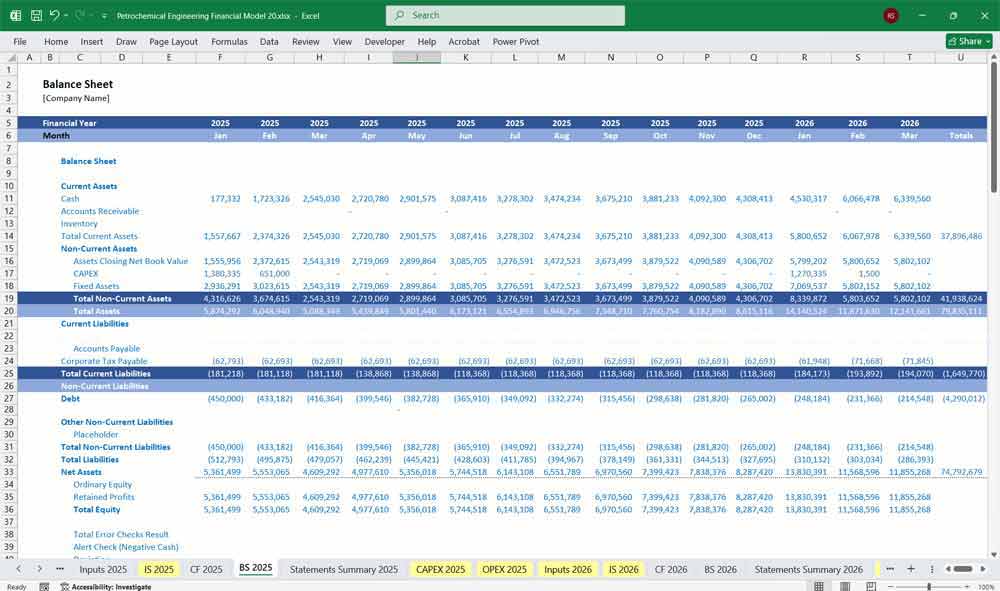
Petrochemical Engineering Company Balance Sheet
A snapshot of the company’s financial position.
A. Assets
1. Current Assets
Cash and Equivalents
Accounts Receivable
Inventory
Raw materials
Work-in-progress (WIP)
Finished goods
Prepaid Expenses
Other Short-Term Assets
2. Non-Current Assets
Property, Plant & Equipment (PP&E)
Petrochemical plants
Pipelines
Machinery & vehicles
Accumulated Depreciation
Capital Work in Progress (CWIP)
Intangible Assets
Licenses, patents, software
Long-term Investments
Deferred Tax Assets (if any)
B. Liabilities
1. Current Liabilities
Accounts Payable
Accrued Expenses
Short-Term Debt
Taxes Payable
Current Portion of Long-Term Debt
2. Non-Current Liabilities
Long-Term Debt
Lease Liabilities
Pension Liabilities
Decommissioning/Environmental Provisions
Deferred Tax Liabilities
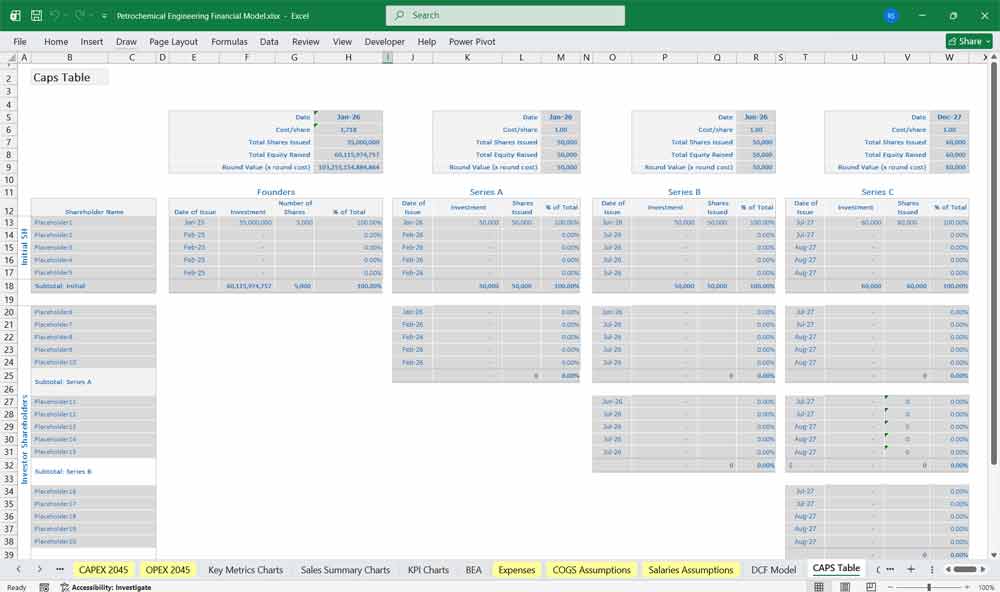
C. Equity
Share Capital
Additional Paid-In Capital
Retained Earnings
Revaluation Reserves (if any)
Non-controlling Interest (in case of subsidiaries)
→ Assets = Liabilities + Equity
Supporting Schedules (optional but recommended)
Revenue Schedule: Volume × Price per product line
COGS Schedule: Linked to input prices and volumes
CapEx Schedule: Linked to project timelines
Debt Schedule: Opening balance, additions, repayments, interest
Depreciation Schedule: Asset classes and useful lives
Working Capital Schedule: DSO, DPO, Inventory Turnover
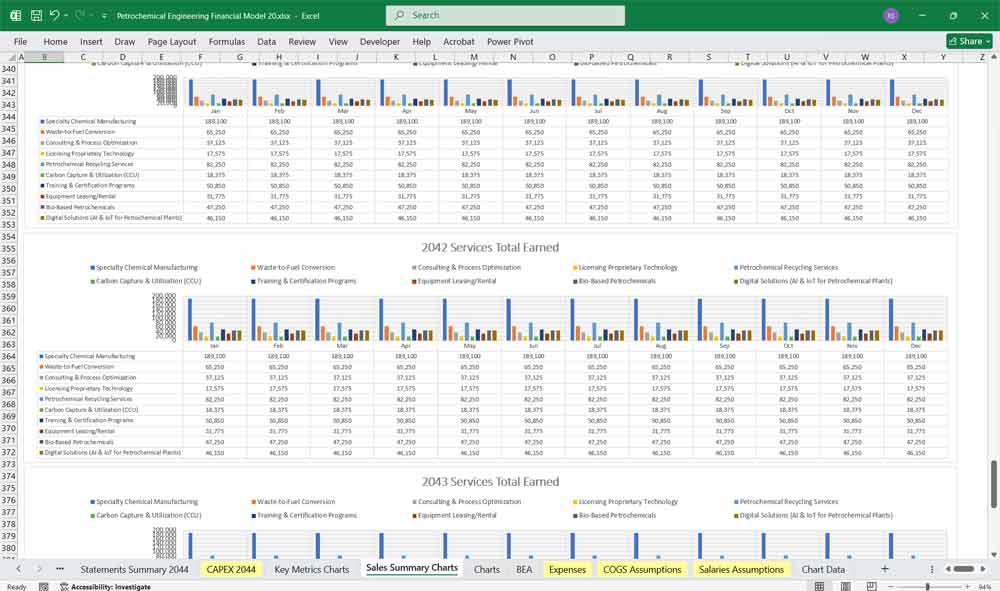
Example Revenues For A Petrochemical Manufacturing Company
1. Specialty Chemical Manufacturing
Produce high-value specialty chemicals (e.g., catalysts, additives, lubricants) for niche markets like pharmaceuticals, electronics, or renewable energy.
2. Waste-to-Fuel Conversion
Develop processes to convert petrochemical waste, plastics, or biomass into synthetic fuels (e.g., pyrolysis oil, biodiesel) and sell to refineries or energy companies.
3. Consulting & Process Optimization
Offer expert consulting services to refineries and chemical plants to improve efficiency, reduce emissions, and optimize production processes.
4. Licensing Proprietary Technology
Develop and license proprietary refining/petrochemical technologies (e.g., advanced catalysts, carbon capture systems) to other companies.
5. Petrochemical Recycling Services
Establish a business unit focused on recycling plastic waste into reusable petrochemical feedstocks (circular economy model).
6. Carbon Capture & Utilization (CCU)
Partner with energy firms to capture CO₂ emissions and convert them into useful products (e.g., methanol, polymers).
7. Training & Certification Programs
Offer specialized training courses, workshops, or certifications for petrochemical engineers and plant operators.
8. Petrochemical Equipment Leasing/Rental
Lease out specialized equipment (e.g., reactors, distillation columns, analyzers) to smaller firms that can’t afford full ownership.
9. Bio-Based Petrochemicals
Invest in R&D for bio-based alternatives (e.g., bio-plastics, green solvents) to cater to sustainability-focused industries.
10. Digital Solutions (AI & IoT for Petrochemical Plants)
Develop AI-driven predictive maintenance software, process automation tools, or IoT sensors for real-time plant monitoring.

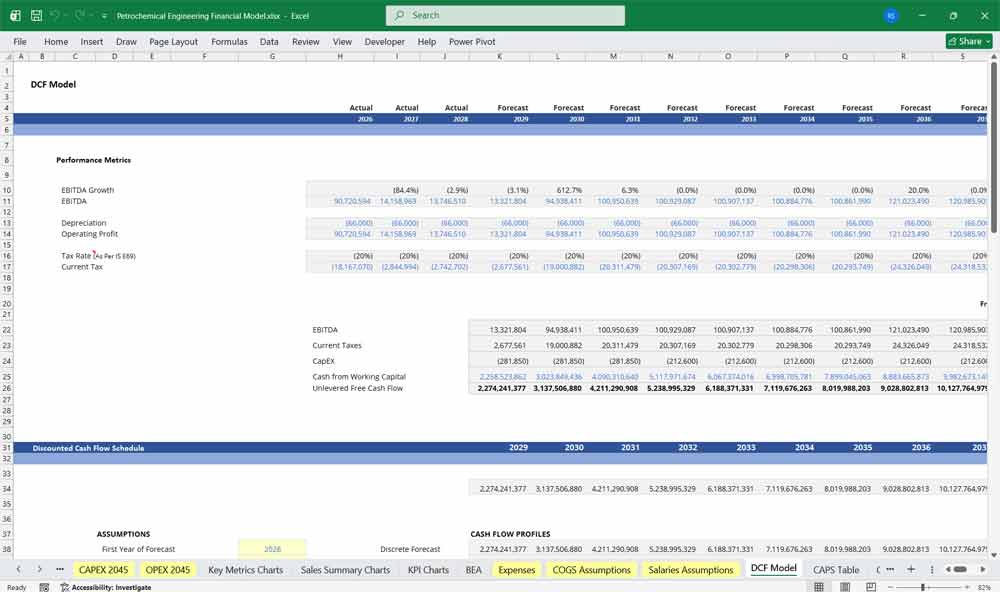
Valuing Your Petrochemical Engineering Company With A Discounted Cash Flow Model
DCF: Valuing the Blueprint and the Backlog
In a 20-year Discounted Cash Flow (DCF) analysis for a petrochemical engineering firm, the valuation is anchored in the “lumpy” cash flows of multi-year EPC (Engineering, Procurement, and Construction) contracts. Unlike a physical plant, an engineering firm’s value is driven by its intellectual property and its ability to consistently convert a project backlog into high-margin billable hours. The model must project the transition from traditional ethylene and propylene plant designs toward circular economy engineering, such as plastic recycling facilities and carbon capture retrofits. The DCF meticulously balances the high cost of specialized “human capital” against the cash inflows from project milestones, ensuring the Net Present Value reflects the firm’s ability to navigate the 20-year evolution of the global chemical supply chain.
WACC: Pricing Human Capital and Liability Risk
The Weighted Average Cost of Capital (WACC) for a petrochemical engineering firm typically carries a “high-beta” risk premium, reflecting its sensitivity to the capital expenditure (CapEx) budgets of global energy giants. While the company may be asset-light compared to the refineries it designs, its discount rate must price in the project-specific liabilities and professional indemnity risks inherent in high-stakes chemical engineering. In the 2026 market, the cost of equity also incorporates a “transition risk”—the possibility that traditional petrochemical projects may face financing headwinds. This higher hurdle rate ensures that future cash flows are appropriately “punished” for the cyclicality of the energy sector and the intense competition for top-tier engineering talent.
Sensitivity Analysis: Stress-Testing Utilization and Billability
For a petrochemical engineering company, Sensitivity Analysis is the primary tool for measuring “operational elasticity.” Since the firm’s primary expense is its payroll, analysts use sensitivity tables to see how a 5% drop in engineer utilization rates or a shift in average billable hourly rates impacts the bottom line. Furthermore, the model must stress-test for project cost overruns—where a fixed-price contract can quickly turn from a profit engine into a cash drain if engineering hours exceed the budget. By testing the impact of a global slowdown in downstream CapEx, the sensitivity analysis reveals the firm’s “break-even” backlog volume, ensuring it can weather a downturn in the commodity cycle without diluting its equity value.
Final Notes On The Financial Model Key Ratios and KPIs
Gross Margin, EBITDA Margin, Net Margin
Return on Equity (ROE), Return on Assets (ROA)
Debt/Equity, Interest Coverage
Cash Conversion Cycle
Capacity Utilization
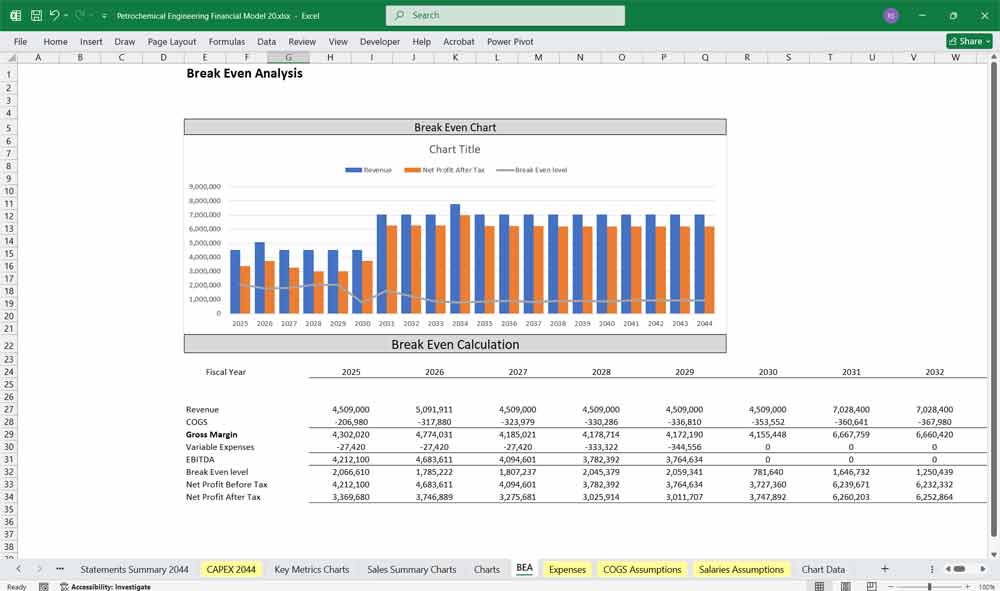
Break-even Price per Metric Ton
Scenario and Sensitivity Analysis
Feedstock cost variation
Product price volatility
Project delay impacts
FX fluctuation scenarios
Regulatory change impact
Download Link On Next Page