
Peer to Peer Lending Financial Model
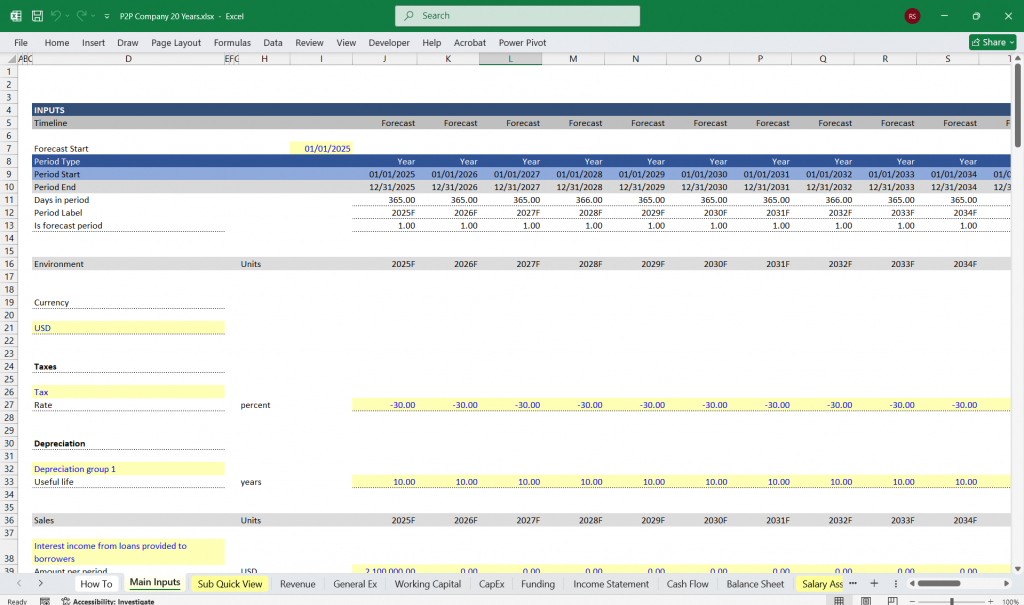
This 3-Statement Peer-to-Peer Lending Financial Model in MS Excel for a (P2P) Lending Platform includes an interconnected Income Statement, Cash Flow Statement, and Balance Sheet to provide a comprehensive financial outlook.
Income Statement (Profit & Loss Statement) For A Peer-To-Peer Loan Company
The income statement reflects the platform’s profitability over a period, capturing revenues, expenses, and net income.
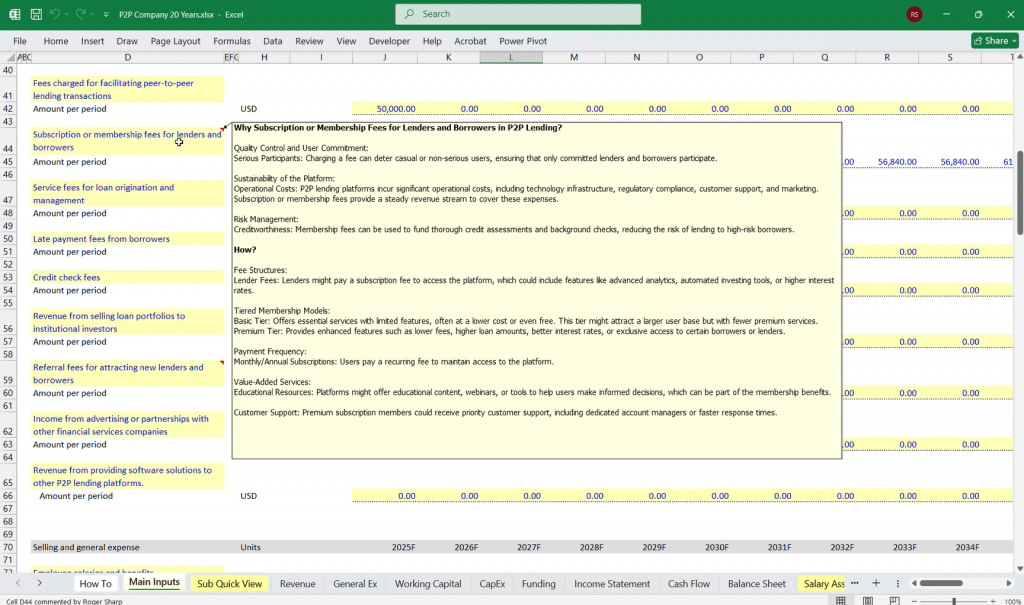
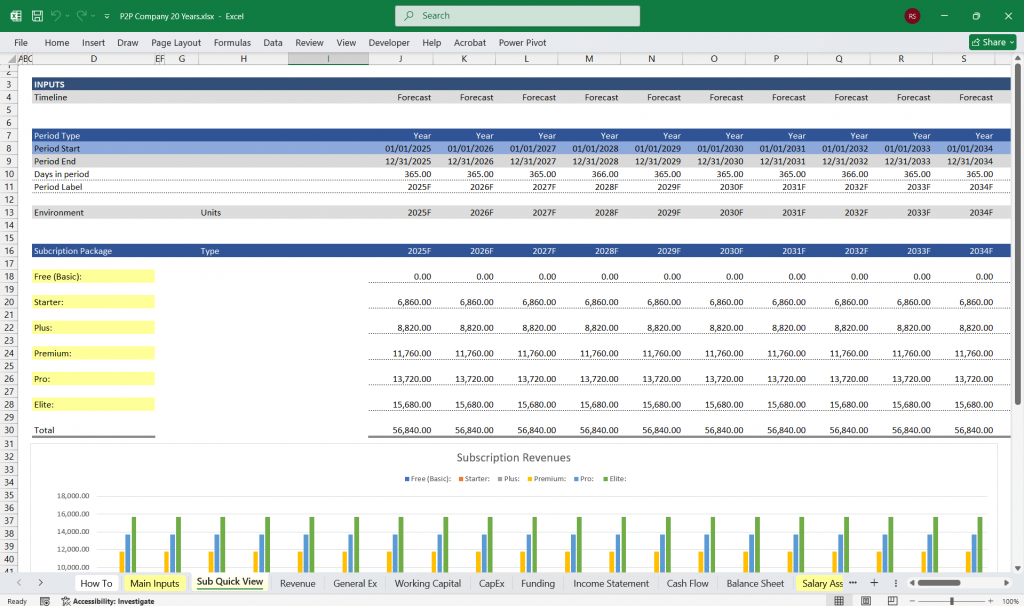
This 6-tier subscription model for a Peer-to-Peer (P2P) Lending Platform allows flexibility for different user segments, from casual investors to high-net-worth individuals and institutional lenders. Below is a structured tier system with features, pricing, and value propositions:
1. Free Tier (Basic) – “Free “Target: New users, small lenders, and casual investors
Features:
- Access to basic marketplace listings
Loan browsing & investing up to a capped amount (e.g., $1,000)
Standard credit scoring data
Basic reporting & portfolio tracking
Standard customer support
No auto-investing or secondary market access
Limited transaction history.
2. Bronze Tier – “Starter “Target: Growing investors, active lenders
Features:
- Everything in Free Tier +
Increased investment cap (e.g., $10,000)
Early access to new loan listings
Basic auto-investing tools
Advanced credit scoring metrics
Community forum access
Limited access to premium loan categories
3. Silver Tier – “Plus”Target: Mid-level investors and frequent lenders.
Features:
- Everything in Bronze Tier +
Unlimited investing (no cap)
Full auto-investing customization
Access to secondary market trading - Portfolio risk analysis & projections
Priority customer support
No API access or custom risk scoring models
4. Gold Tier – “Premium”Target: High-net-worth individuals and serious investors.
Features:
- Everything in Silver Tier +
VIP loan listings with exclusive deals
Customized credit risk scoring tools
Tax optimization & advanced reporting
Early access to platform innovations
Dedicated account manager - Limited institutional investment tools
5. Platinum Tier – “Pro”Target: Family offices, hedge funds, and large-scale lenders.
Features:
- Everything in Gold Tier +
API access for automated investing
Bulk loan purchasing options
Real-time data feeds & analytics dashboards
Direct integration with external financial tools
Customizable risk assessment models
No private lending pools or white-label solutions
6. Diamond Tier – “Elite”Target: Large-scale financial institutions, banks, and fintech firms.
Features:
- Everything in Platinum Tier +
White-label solutions for branded lending platforms
Private loan pools & syndicate investing
Full regulatory compliance support
Custom AI-driven credit scoring solutions
Dedicated data science & engineering support
24/7 dedicated account & risk management team.
Additional Monetization Add-ons (For Any Tier):
Pay-Per-Use API Calls – Charge per credit risk API query.
One-Time Loan Analysis Reports – Detailed insights on borrower risk.
Premium Customer Support Package – Instant support for lower tiers.

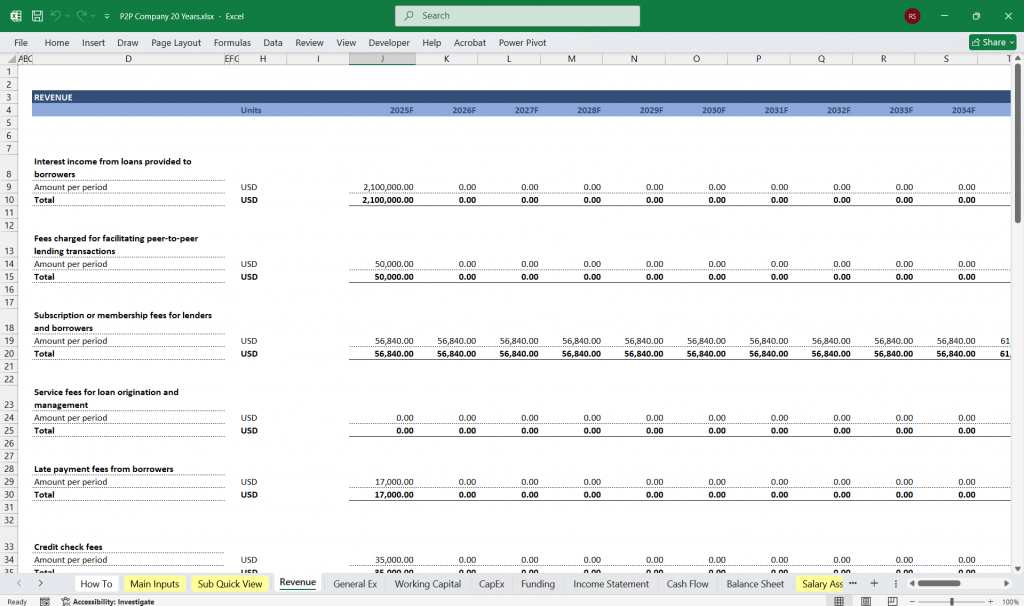
Revenue Streams For A Peer-to-Peer Loan Company
- Loan Origination Fees – Fees charged to borrowers upon successful loan issuance (e.g., 1%-5% of loan amount).
- Servicing Fees – Ongoing fees charged to investors/lenders for managing loans (e.g., 0.5%-2% of outstanding loan balance).
- Late Payment Fees – Penalties imposed on borrowers for overdue payments.
- Interest Spread – If the platform funds loans itself, it earns an interest spread between borrower rates and lender returns.
- Secondary Market Fees – If the platform allows loan resale, it earns transaction fees.
- Subscription Fees – Fees for premium services or enhanced investor tools.
- Advertising Revenue – Income from third-party ads if applicable.
Cost of Revenue (COGS/Direct Costs)
- Loan Processing Costs – Credit checks, KYC (Know Your Customer), and fraud detection.
- Transaction Costs – Payment gateway charges for fund transfers.
- Customer Support Costs – Support staff and dispute resolution.
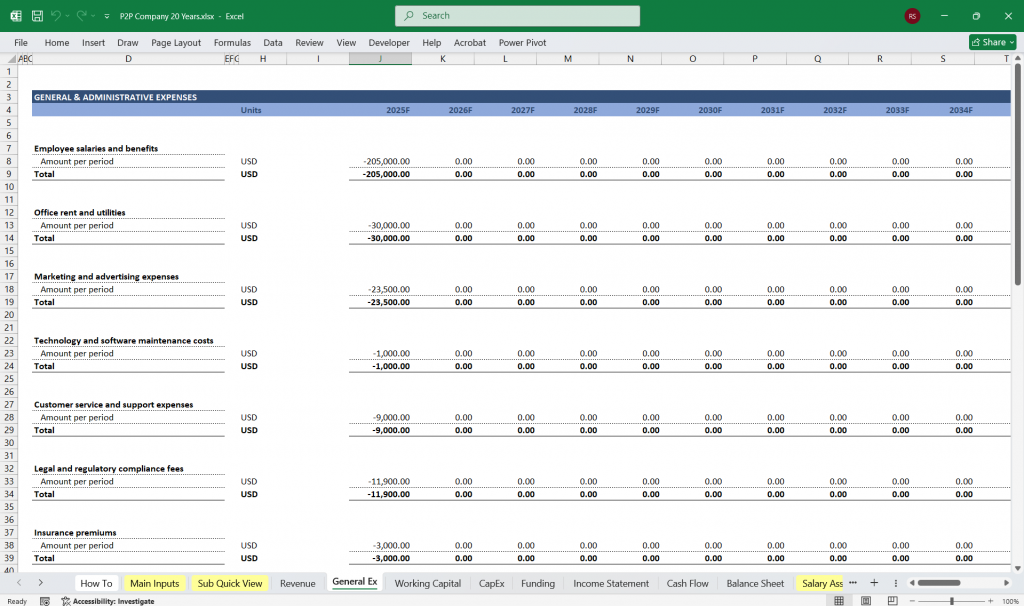
Operating Expenses
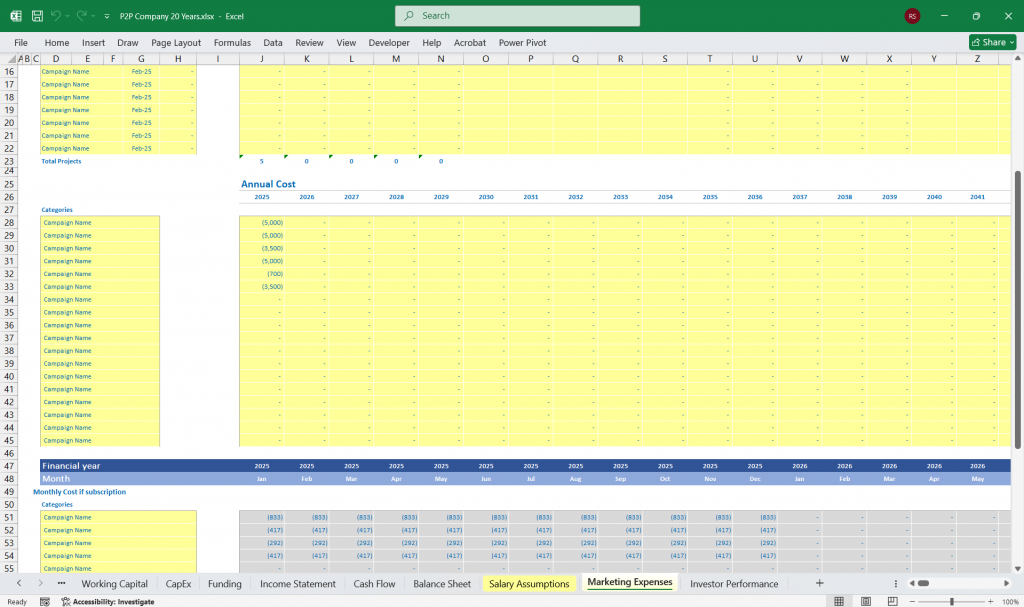
- Marketing & Customer Acquisition – Digital marketing, referral programs, and affiliate partnerships.
- Technology & Platform Development – IT infrastructure, app maintenance, and cybersecurity.
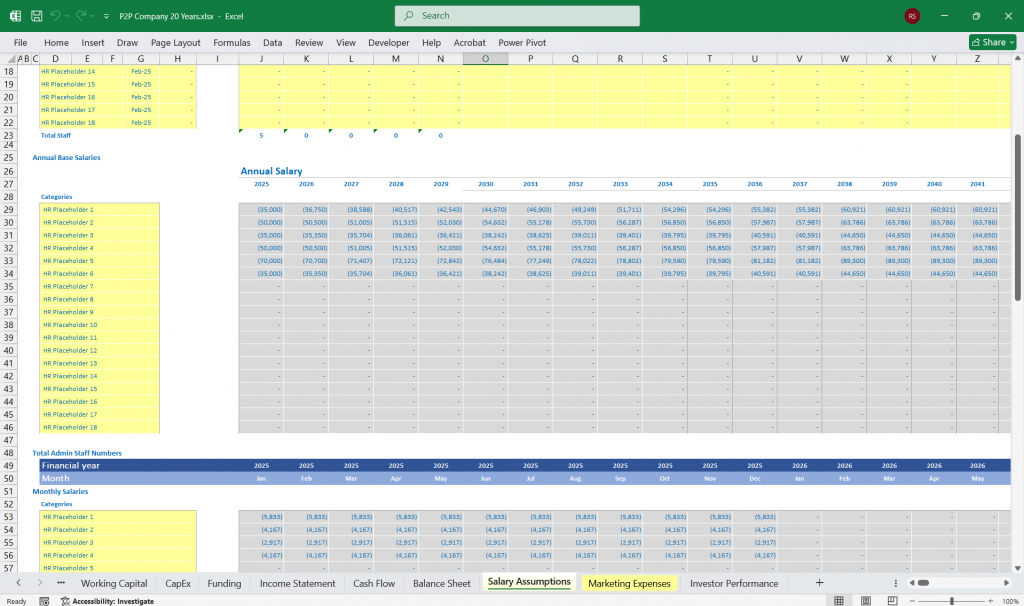
- Employee Salaries & Benefits – Operations, compliance, engineering, and finance teams.
- Regulatory & Compliance Costs – Legal fees, licenses, and audits.
- Office & Administrative Costs – Rent, utilities, and general admin expenses.
EBITDA (Earnings Before Interest, Taxes, Depreciation, and Amortization)
- EBITDA = Revenue – (COGS + Operating Expenses)
Depreciation & Amortization
- Includes amortization of software development costs and depreciation of office assets.
Operating Income (EBIT)
- EBIT = EBITDA – Depreciation & Amortization
Interest Expense & Taxes
- If the platform has borrowed funds or earns interest, it is reflected here.
- Taxes depend on jurisdiction and applicable tax rates.
Net Income
- Net Income = EBIT – Interest – Taxes
- Represents overall profitability for the period.
Peer-To-Peer Cash Flow Statement
Tracks cash movements to assess liquidity and operational efficiency.
Operating Cash Flow
- Net Income Adjustments – Adding back non-cash expenses like depreciation and amortization.
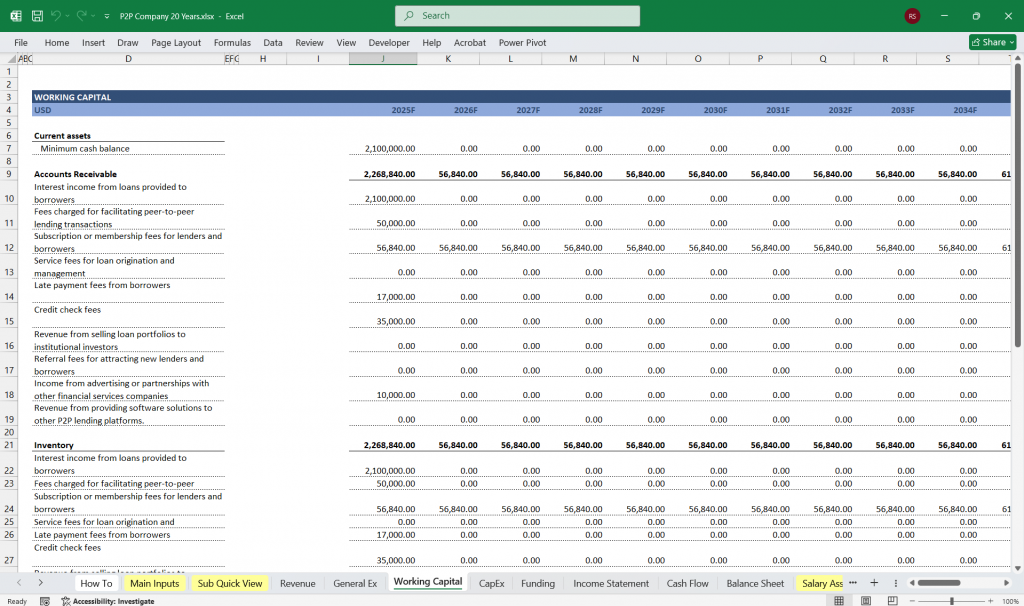
- Changes in Working Capital – Adjustments in receivables, payables, and accrued expenses.
- Loan Disbursements & Repayments – If the platform engages in direct lending, these appear here.
- Fees & Revenue Collections – Cash received from borrowers and lenders for platform services.
Investing Cash Flow
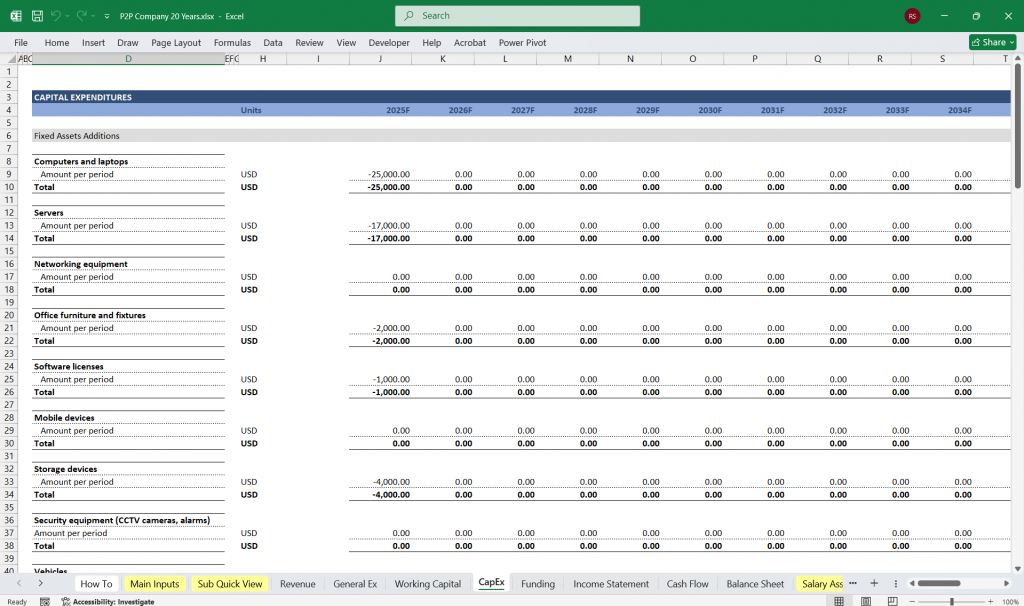
- Capital Expenditures (CapEx) – Spending on technology, office equipment, and software.
- Acquisitions & Investments – If the company invests in partnerships, R&D, or acquisitions.
Financing Cash Flow
- Equity Funding – Cash inflow from venture capital, private equity, or IPO.
- Debt Financing – Loans raised by the platform.
- Dividends & Buybacks – If the company distributes earnings to shareholders.
Net Change in Cash
- Summarizes total cash inflows and outflows.
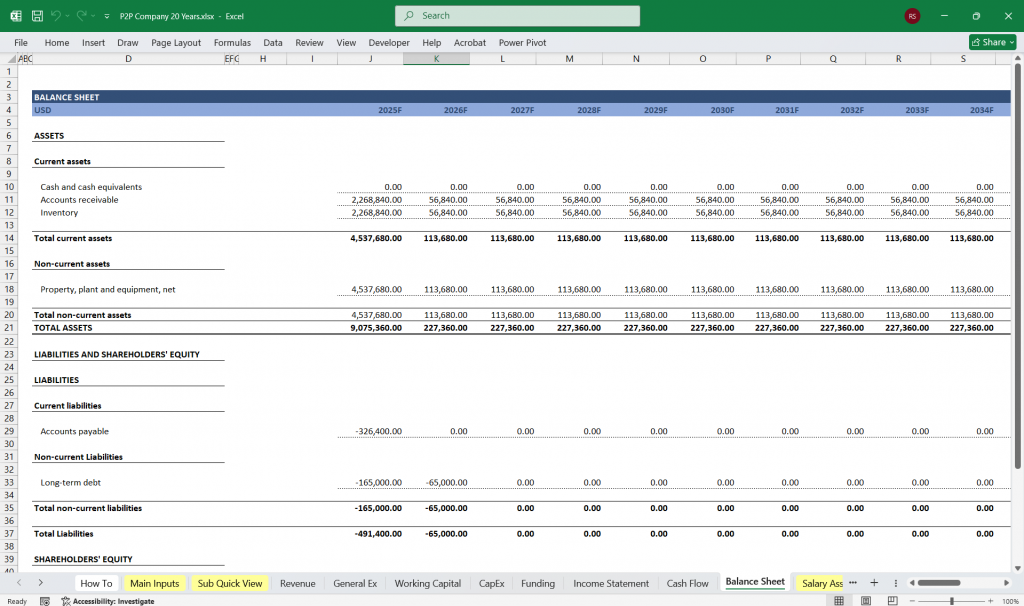
Peer-To-Peer Balance Sheet
Reflects the company’s Per-to-Peer Lending financial position at a point in time.
AssetsCurrent Assets
- Cash & Equivalents – Cash reserves from operations and funding.
- Accounts Receivable – Outstanding fees due from lenders or borrowers.
- Loan Receivables – If the platform lends directly, outstanding loan balances.
Non-Current Assets
- Technology & Software – Capitalized development costs.
- Office & Equipment – Hardware, office space, and infrastructure.
- Investments – Strategic investments in other companies or projects.
LiabilitiesCurrent Liabilities
- Accounts Payable – Unpaid expenses and vendor obligations.
- Deferred Revenue – Fees collected for services not yet delivered.
- Borrowings (Short-Term) – Any short-term debt obligations.
Non-Current Liabilities
- Long-Term Debt – Any loans or financing raised by the company.
- Investor Liabilities – If managing funds on behalf of lenders, recorded as liabilities.
Equity
- Common Stock & Retained Earnings – Represents ownership capital and cumulative profits.
- Additional Paid-in Capital – Funds raised above the par value of issued stock.
Interconnectivity of the 3 Statements For A Peer-to-Peer Loan Company
- Net Income from the Income Statement flows into Operating Cash Flow (Cash Flow Statement) and Retained Earnings (Balance Sheet).
- Depreciation & Amortization from the Income Statement are added back into the Cash Flow Statement but reduce the Asset Value (Balance Sheet) over time.
- Loan Disbursements & Repayments affect Cash Flow and are reflected as Loan Receivables or Liabilities in the Balance Sheet.
- Equity & Debt Financing in the Cash Flow Statement affects the Liabilities & Equity sections of the Balance Sheet.
Conclusion For The Financial Model
This 3-statement Peer-to-Peer Lending Financial Model platform provides insights into revenue generation, cost management, cash flows, and financial health. Key considerations include:
- Scalability of fee-based revenue models
- Credit risk exposure if lending directly
- Regulatory compliance costs
- Customer acquisition efficiency (CAC vs. LTV)


Download Available Immediately After Payment