
Green Hydrogen Plant Financial Model
This 20-Year, 3-Statement Excel Green Hydrogen Plant Financial Model includes revenue streams from pipeline distribution, high-pressure trailers, oxygen etc. Sensitivity analysis on power prices vs. electrolyzer degradation, expenditures, Discounted Cash Flow (DCF) with Terminal Value, Sensitivity Analysis, WACC, and financial statements to forecast the financial health of your Green Hydrogen Plant fully.
Financial Model for a Green Hydrogen Plant
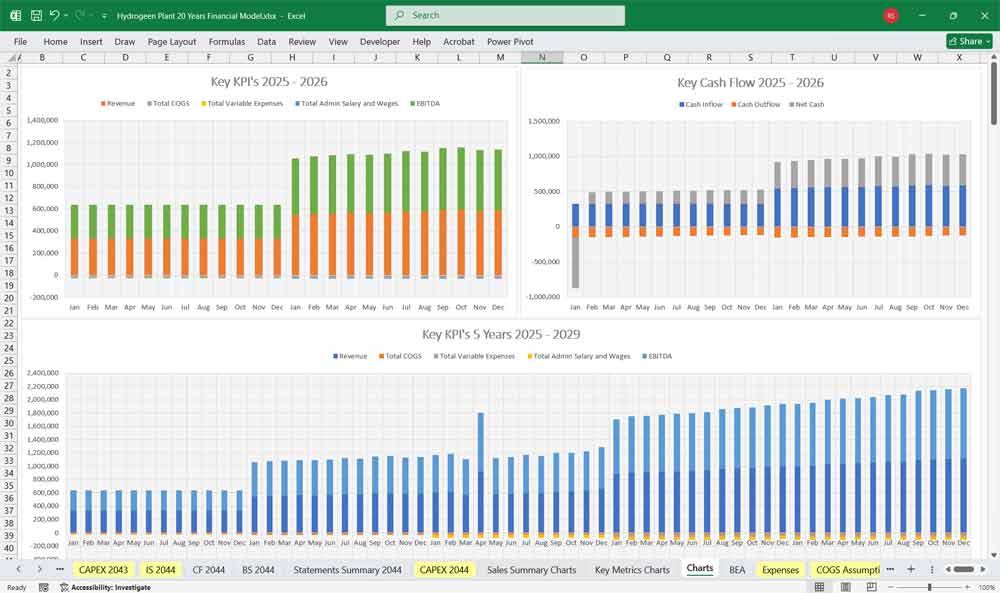
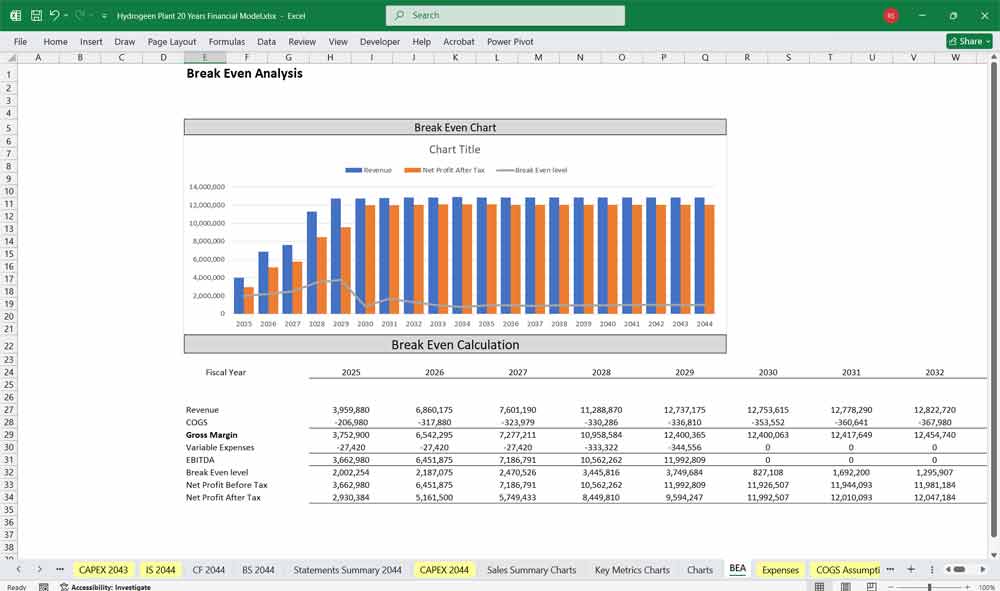
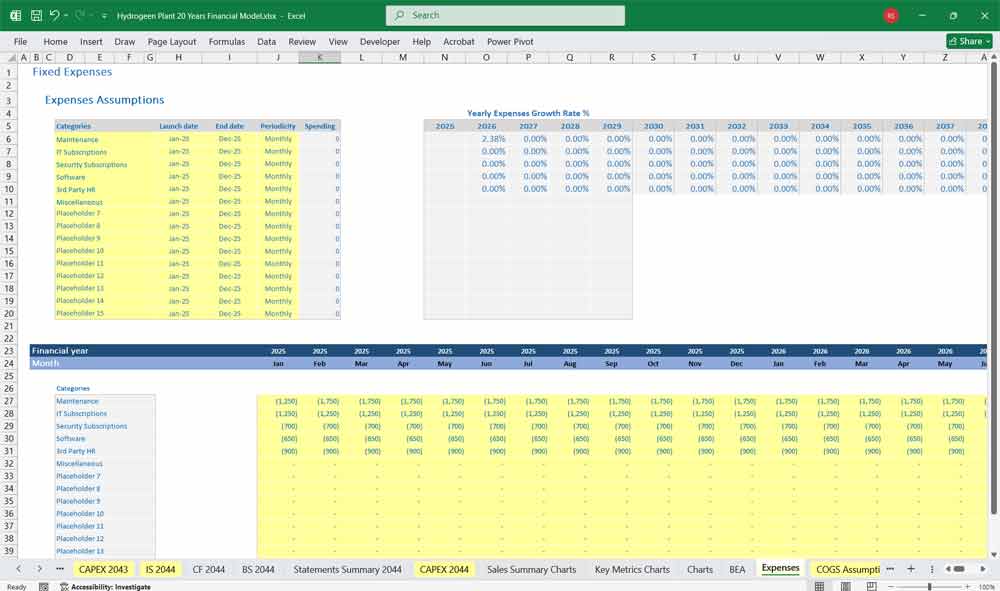
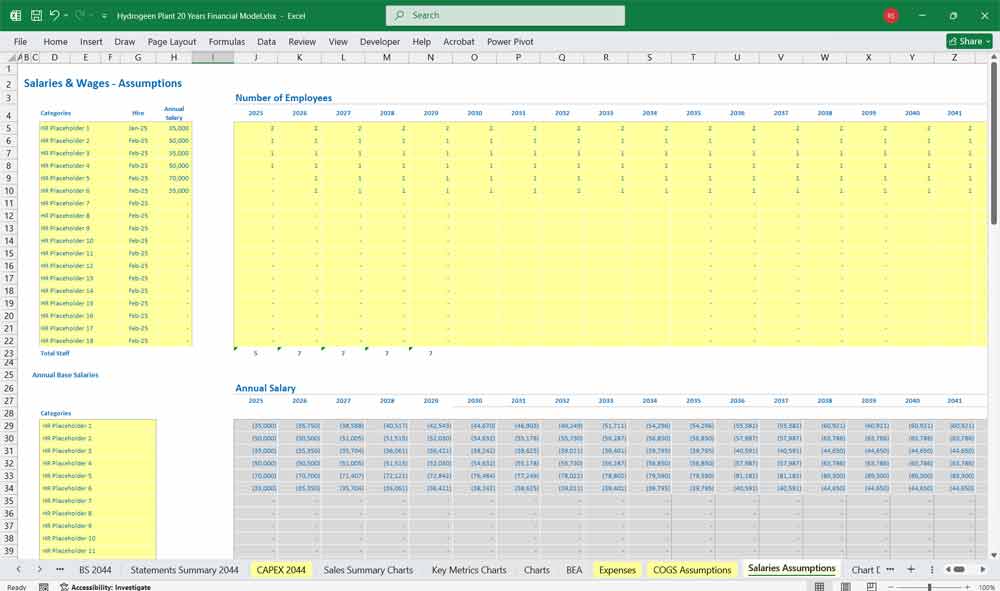
This 20 year model involves detailed revenue projections, cost structures, capital expenditures, and financing requirements. The model provides a thorough understanding of the financial viability, profitability, and cash flow position of the plant. Includes Hydrogen sales revenue, by product revenue, and gained subsidies: 20x Income Statements, Cash Flow Statements, Balance Sheets, CAPEX sheets, OPEX Sheets, Dedicated Sensitivity analysis on power prices vs. electrolyzer degradation tab, Statement Summary Sheets, and Revenue Forecasting Charts with the specified revenue streams, BEA charts, sales summary charts, employee salary tabs and expenses sheets. Over 140 spreadsheets in 1 Workbook for close monitoring of your Green Hydrogen Plant financials.
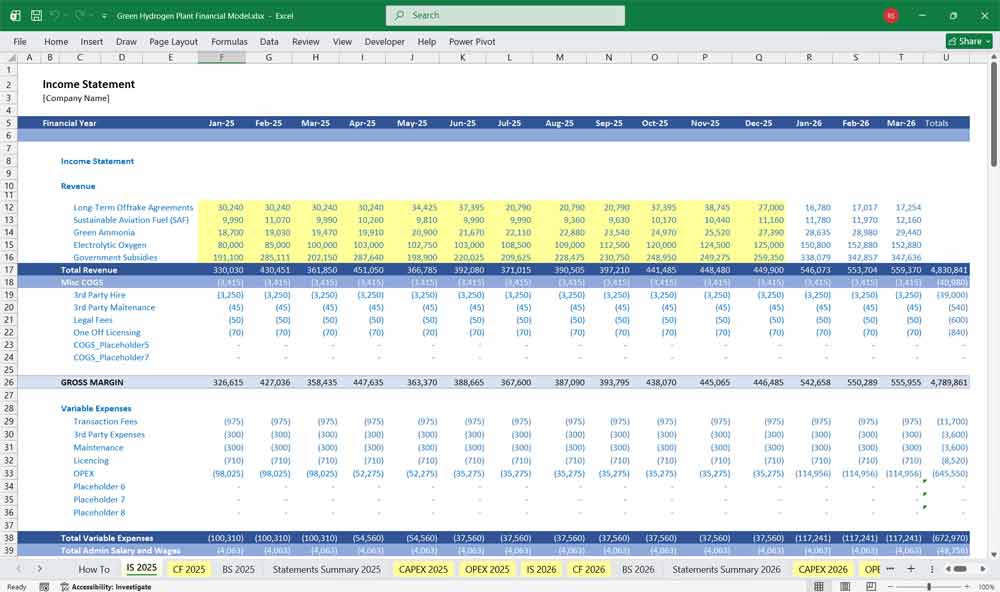
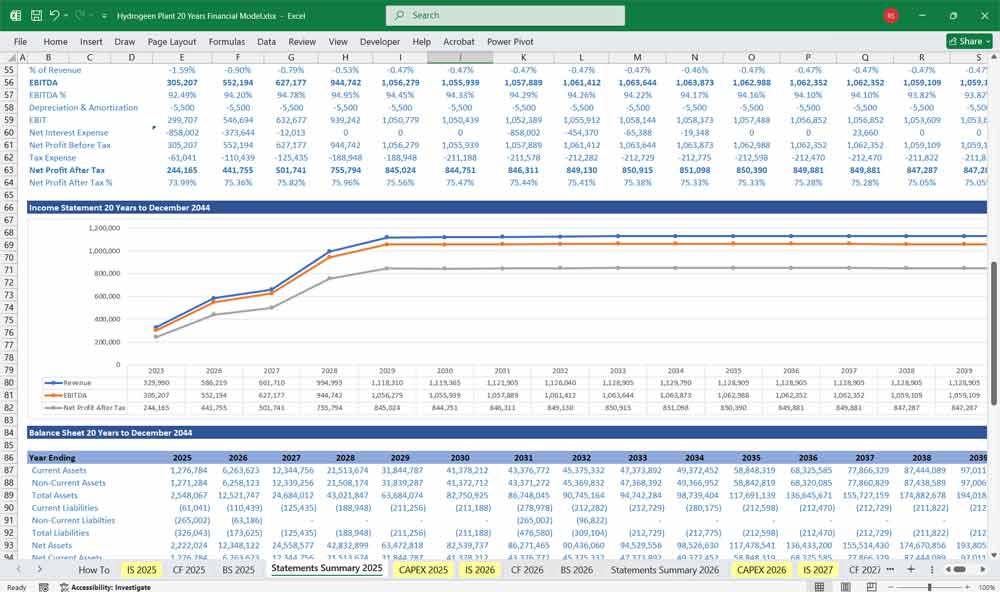
Income Statement (Profit & Loss Statement)
The Income Statement summarizes revenues, costs, and profit over a specific period (typically annually or quarterly).
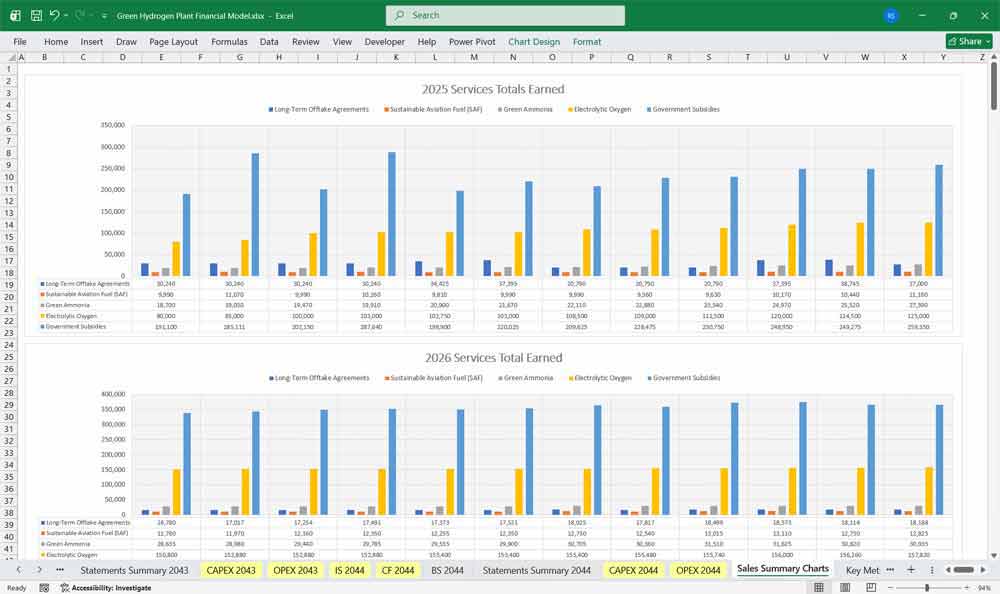
1. Revenue
Long-Term Offtake Agreements:
Revenue is generated by selling green hydrogen to industries that are hard to decarbonize, such as steelmaking, chemical production, etc.Sustainable Aviation Fuel (SAF):
Sustainable Aviation Fuels (SAF) for the aviation sector.- Green Amonia:
Carbon Fertilizer Production, and as a clean marine fuel. - Oxygen Sales:
Used for Wastewater Treatment, Metal Welding/Cutting, and steel manufacturing. - Government Subsidies:
Production Tax Credits (PTC) based on carbon intensity or Investment Tax Credits (ITC).
2. Cost of Goods Sold (COGS)
Feedstock Costs:
Electricity (for electrolysis or other process)
Water (for electrolysis)
Natural gas (if using steam methane reforming)
Operating Labor Costs
Maintenance & Consumables
Spare Parts
3. Gross Profit
Gross Profit=Revenue−COGS\text{Gross Profit} = \text{Revenue} – \text{COGS}Gross Profit=Revenue−COGS
4. Operating Expenses
Salaries & Administration
Insurance
Permits and Licensing
R&D (if applicable)
5. EBITDA (Earnings Before Interest, Taxes, Depreciation & Amortization)
6. Depreciation & Amortization
Based on capital expenditure (CapEx) and asset life
7. EBIT (Operating Income)
8. Interest Expense
Based on loan amortization schedules
9. Pre-Tax Income
10. Taxes
Corporate income tax (adjusted for tax credits or green incentives)
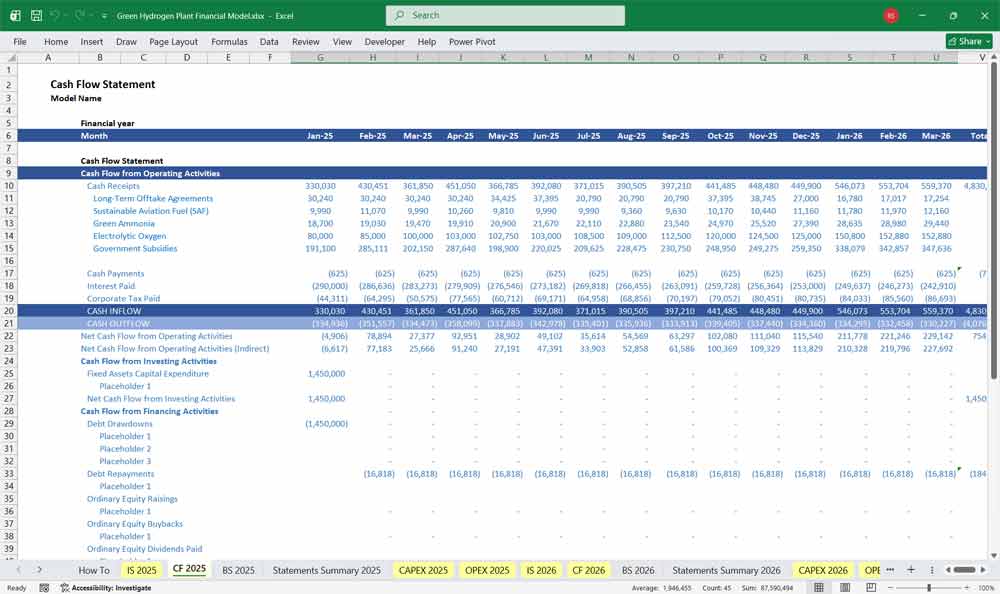
Green Hydrogen Plant Cash Flow Statement
This shows actual cash movement, divided into Operating, Investing, and Financing activities.
A. Operating Cash Flow
Net Income
+ Depreciation/Amortization (non-cash)
+/- Changes in Working Capital:
Inventory
Receivables
Payables
Operating Cash Flow: True cash from operations
B. Investing Cash Flow
Capital Expenditures (CapEx):
Electrolyzers, compressors, storage tanks, piping, control systems, etc.
Plant Expansion or Upgrades
Asset Disposals (if any)
C. Financing Cash Flow
Debt Issued or Repaid
Equity Raised
Interest Paid
Dividends Paid
D. Net Cash Flow
Net Cash Flow=A + B + C\text{Net Cash Flow} = \text{A + B + C}Net Cash Flow=A + B + C
E. Cash at Beginning & End of Period
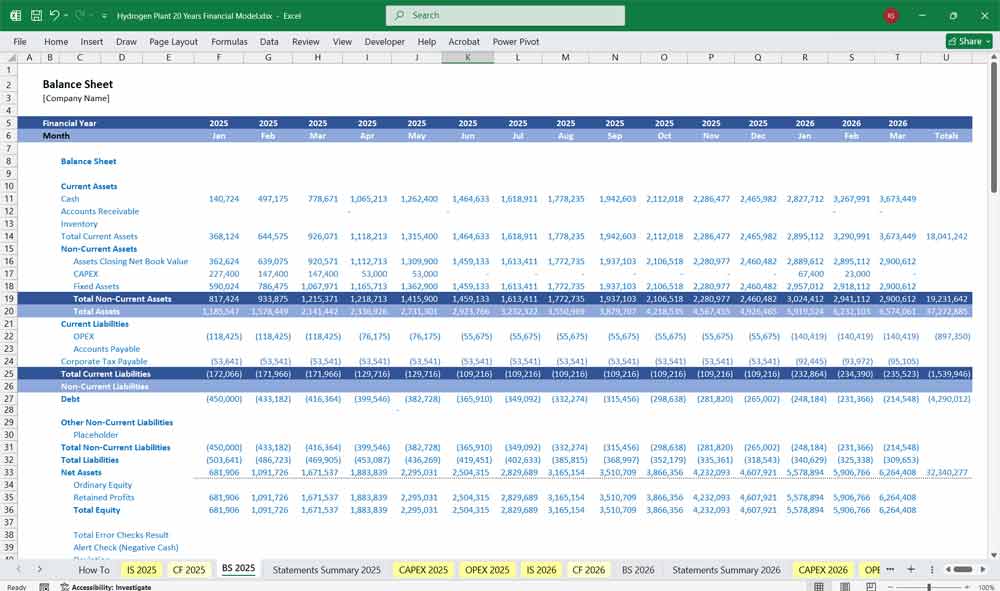
Green Hydrogen Plant Balance Sheet
The Balance Sheet reflects the company’s financial position at a specific point in time.
Assets
1. Current Assets
Cash and Cash Equivalents
Accounts Receivable
Inventory (hydrogen stored, spare parts)
Prepaid Expenses
2. Non-Current Assets
Property, Plant & Equipment (PP&E):
Electrolyzers
Storage and distribution infrastructure
Land
Accumulated Depreciation
Intangible Assets (if applicable)
Deferred Tax Assets
Liabilities
1. Current Liabilities
Accounts Payable
Short-Term Loans/Leases
Accrued Expenses
2. Long-Term Liabilities
Long-Term Debt
Deferred Tax Liabilities
Lease Obligations
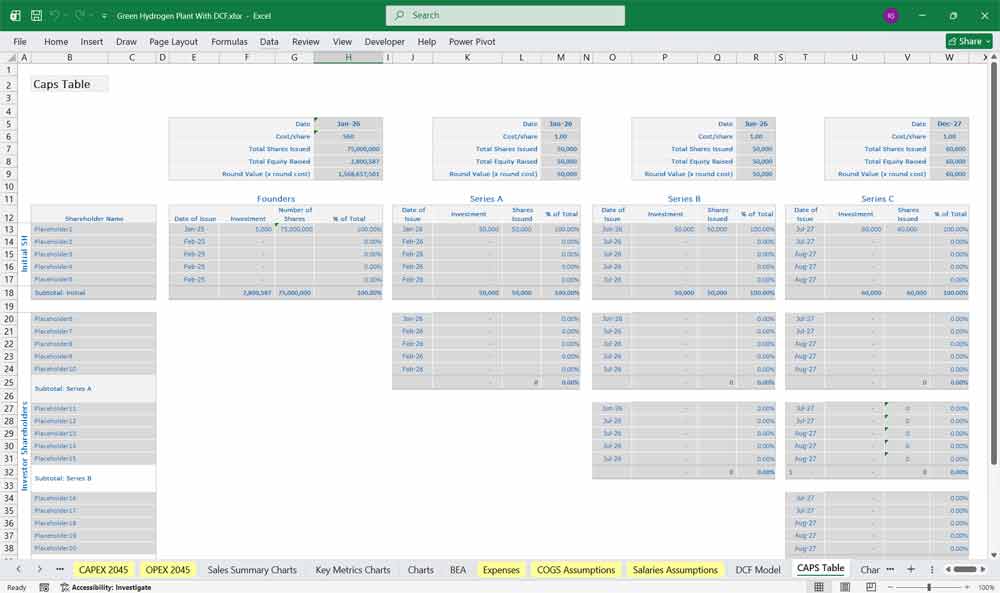
Equity
Common Stock
Additional Paid-In Capital
Retained Earnings
Equity Contributions (if from strategic partners or government grants)
Accumulated Other Comprehensive Income
Key Supporting Schedules (used across statements)
Production Schedule: Hydrogen Plant uptime, capacity utilization, degradation
Price Forecasts: Electricity, hydrogen selling price, feedstock inputs
CapEx Schedule: Timing of investment, inflation, replacement cycles
Debt Schedule: Repayment terms, interest rate, covenants
Tax Schedule: Tax rates, tax credit schemes (e.g., green hydrogen subsidies)
Working Capital Assumptions: Days receivable, inventory turnover, etc.
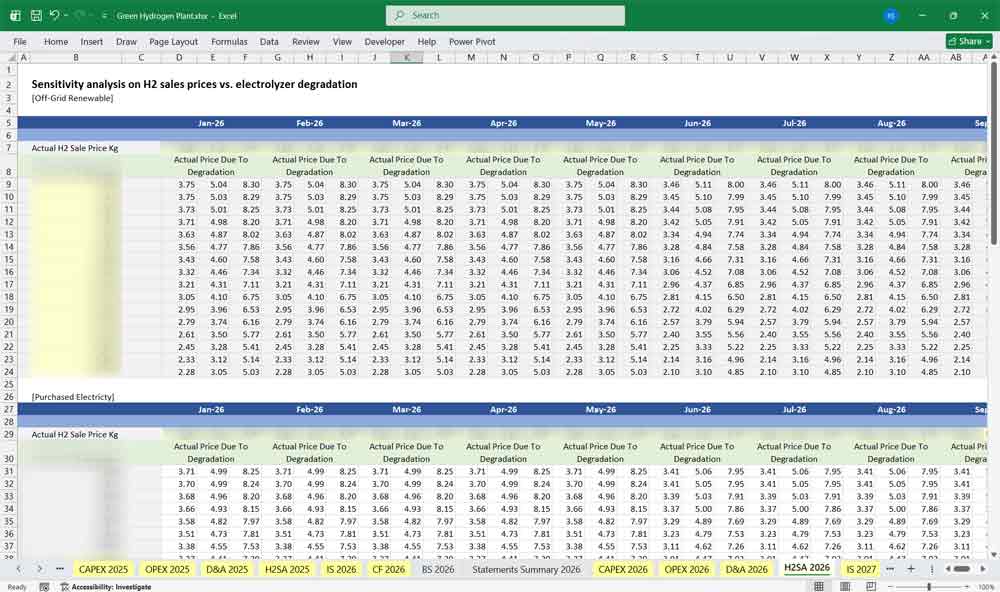
- Sensitivity analysis on power prices vs. electrolyzer degradation
- Reverse Osmosis (RO) Unit Degradation
Pipeline Distribution at a Green Hydrogen Plant & Impact of Cost Fluctuations
Pipeline distribution used in this financial model is a common and efficient method for transporting hydrogen from production plants to end-users, such as industrial facilities, refineries, or fueling stations. Unlike truck or rail transport, pipelines offer lower long-term operating costs and higher delivery volumes, making them ideal for large-scale hydrogen projects. However, pipeline infrastructure requires significant upfront capital expenditure (CapEx) for construction, compression stations, and safety systems, along with ongoing maintenance costs.
Green Hydrogen Plant Cost Fluctuation
Fluctuations in key cost drivers—such as electricity prices (for compression), Reverse Osmosis (RO) Units, steel prices (for pipeline materials), and labor costs—can directly impact operational expenses, reducing profit margins if not offset by higher hydrogen prices. Additionally, if hydrogen market prices decline due to oversupply or policy changes, be sure to analyse revenue within the financial model to cover rising distribution costs, and make sure this doesn’t negatively affect the plant’s financial viability. To mitigate these risks, operators often secure long-term supply contracts with price escalation clauses or hedge against volatile energy inputs.
Liquefied Hydrogen Tanker Distribution & Financial Model Impact
Liquefied hydrogen tankers provide a flexible distribution solution for green hydrogen plants, particularly when pipeline infrastructure is unavailable or uneconomical. The Dedicated Operating Expenditure (OPEX) tab helps monitor these heavily influenced costs. Unlike gaseous hydrogen transport, liquefaction reduces volume, enabling more efficient long-distance delivery. However, this method involves high energy costs for cryogenic cooling (to -253°C) and specialized insulated tankers, leading to significant variable transport expenses. Fluctuations in fuel prices (affecting trucking/shipping costs), electricity rates (impacting liquefaction energy needs), and maintenance expenses for cryogenic equipment can substantially alter operational costs.
Pricing Variables With A Green Hydrogen Plant
In a financial model, these variables directly affect the Cost of Goods Sold (COGS) and gross margins, particularly if hydrogen sales contracts lack price adjustments. Rising transport costs without corresponding revenue increases can erode profitability, while lower-than-expected demand may leave tankers underutilized, further straining unit economics. Sensitivity analysis should assess break-even transport costs and potential hedging strategies (e.g., fixed-price fuel contracts) to stabilize cash flows.
Oxygen Byproduct Revenue at a Green Hydrogen Plant & Financial Model Implications
Many hydrogen production methods, particularly electrolysis, generate oxygen as a byproduct, which can be captured and sold to industrial users (e.g., medical applications, steel manufacturing, or wastewater treatment). This additional revenue stream helps offset production costs and improves the plant’s overall economics. However, oxygen revenue is subject to market fluctuations—price volatility depends on regional demand, competing suppliers, and industrial activity levels.
Revenue Fluctuation And Your Green Hydrogen Plant
In a financial model, variations in oxygen pricing or sales volume directly impact total revenue and gross profit margins. If oxygen prices decline due to oversupply or reduced demand, the plant’s profitability may weaken unless hydrogen revenues compensate. Conversely, strong oxygen markets enhance cash flow and reduce payback periods. Sensitivity analysis should assess scenarios where oxygen revenue drops by 20-30%, testing the model’s resilience. Additionally, storage or purification costs for oxygen (if not immediately sold) must be factored into operating expenses to avoid overestimating net benefits. Including conservative oxygen revenue assumptions ensures a more robust financial projection.
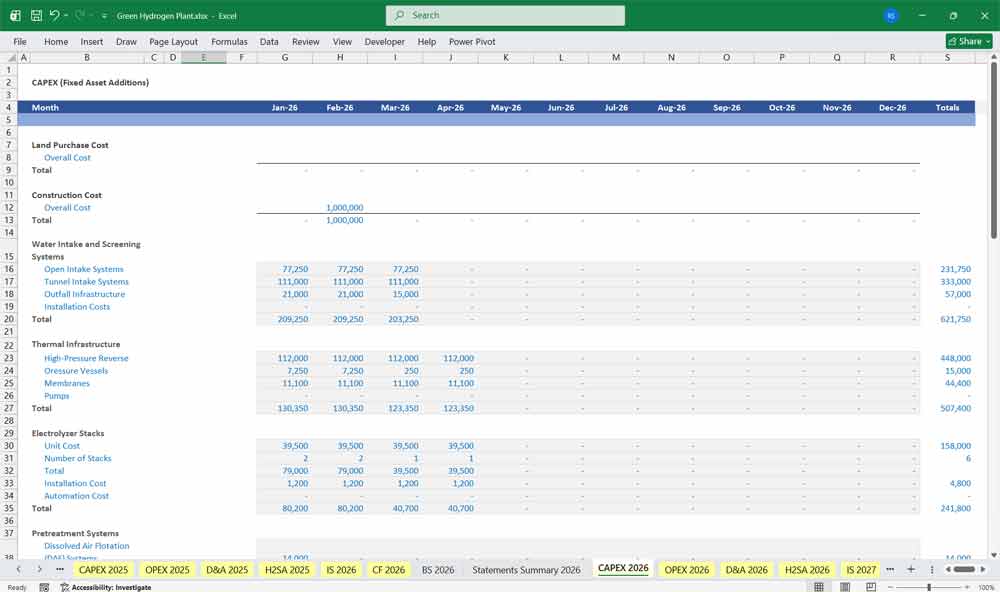
Electrolyzer Purchase and Installation at your Green Hydrogen Plant & CAPEX Sensitivity to Cost Variations
The construction of an electrolyzer system represents a major component of a hydrogen plant’s capital expenditure (CAPEX), with costs influenced by three key variables: engineering design, equipment procurement, and installation. Engineering costs, which include feasibility studies, process design, and permitting, can fluctuate based on project complexity and regulatory requirements. Equipment costs—such as electrolyzer stacks, power converters, and balance-of-plant systems—vary with technology type (ALK, PEM, or SOEC), supplier pricing, and scale efficiencies.
Variable Expenses At A Hydrogen Plant
Installation expenses, covering labor, civil works, and commissioning, are sensitive to regional labor rates, site conditions, and logistical challenges. If any of these cost categories exceed initial estimates—due to supply chain delays, inflation, or design changes—the total CAPEX can escalate significantly, impacting project feasibility. For instance, a 20% increase in electrolyzer equipment costs alone could raise CAPEX by millions, extending the payback period or requiring additional financing. To mitigate risks, financial models should incorporate contingency buffers (10-15%) and scenario analysis to assess CAPEX sensitivity, ensuring robust project planning and investor confidence.
Hydrogen Storage Tanks at a Green Hydrogen Plant & CAPEX
Hydrogen storage tanks are a critical component of a hydrogen plant’s infrastructure, ensuring supply stability and operational flexibility. The capital expenditure (CAPEX) for these tanks is influenced by three primary cost drivers: engineering design, equipment procurement, and installation. Engineering costs cover tank specifications, safety compliance, and integration with production systems, which can vary based on pressure requirements (low-pressure gaseous vs. cryogenic liquid storage) and regulatory standards.
CAPEX And A Hydrogen Plant Startup
Equipment costs depend on storage type (e.g., composite vessels for high-pressure gas or vacuum-insulated tanks for liquid hydrogen), material prices (e.g., carbon fiber or stainless steel), and supplier market conditions. Installation expenses, including site preparation, foundation work, and system integration, are subject to labor rates, logistical challenges, and geographic factors. If any of these cost categories exceed projections—due to design changes, supply chain disruptions, or unforeseen site conditions—the total CAPEX can rise substantially, impacting the project’s financial viability. For example, a 15% increase in composite tank costs or higher-than-expected installation labor rates could significantly inflate upfront investments, delaying ROI. To manage these risks, financial models should incorporate cost contingencies (10-20%) and scenario testing to evaluate CAPEX resilience under varying price and execution conditions. This ensures more accurate budgeting and investor confidence in the project’s economic feasibility.
Electrolyzers dominate the cost variation impact, making them the most critical component to control in project budgeting within a financial model environment.
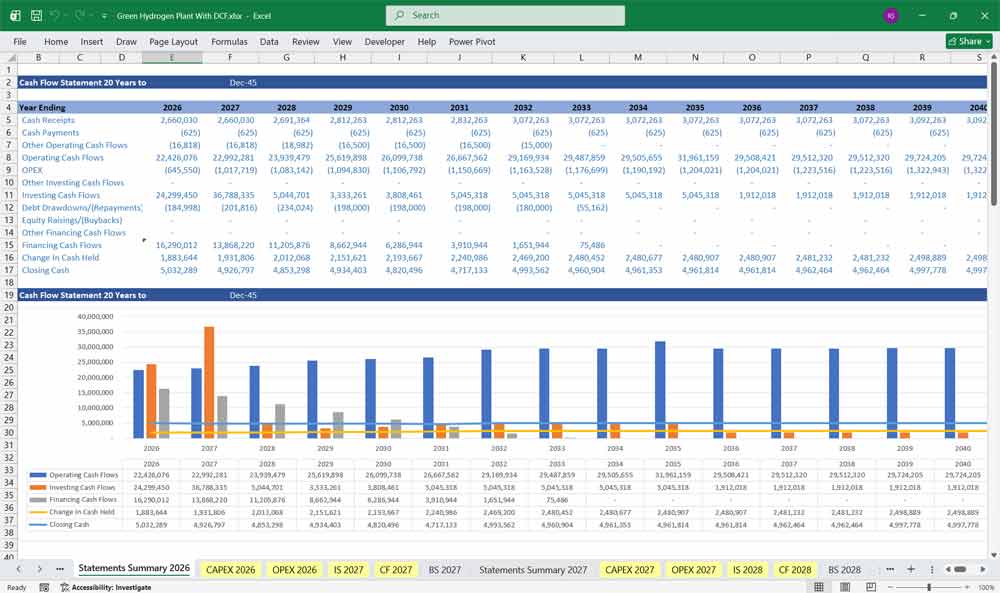
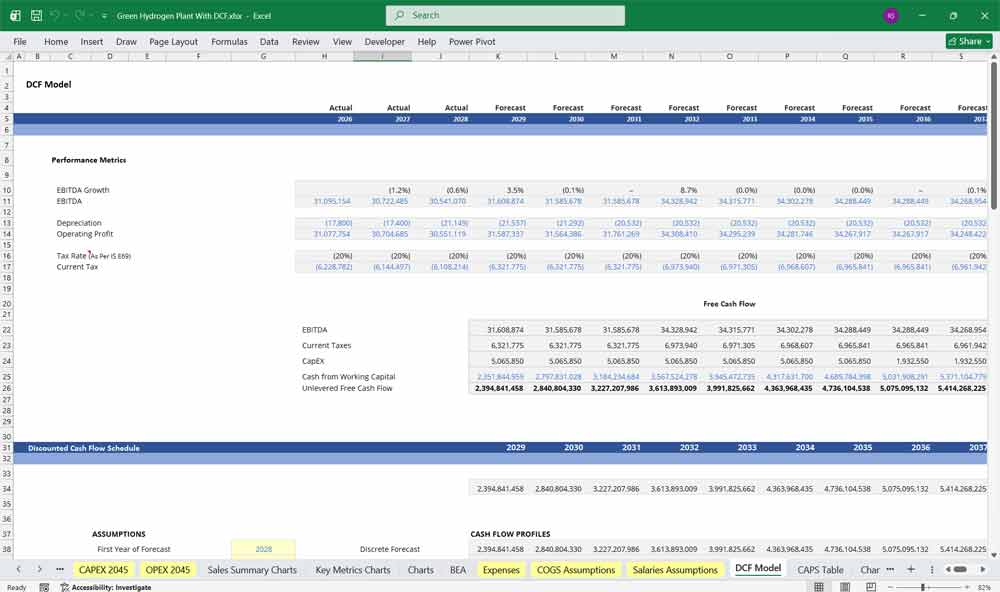
Green Hydrogen Plant Discounted Cash Flow (DCF) with Terminal Value, Sensitivity Analysis, and WACC Model add-on
DCF: Valuing a Nascent Energy Transition Asset
In a Discounted Cash Flow (DCF) analysis for a Green Hydrogen plant, the model must capture the transition from high initial capital expenditure (CapEx) to a long-term operational phase driven by “off-take” agreements. Unlike mature industries, the 20-year DCF for green hydrogen often projects a “hockey stick” growth curve, where early years are defined by heavy investment in electrolyzer stacks and renewable energy integration, followed by scaling revenues as the levelized cost of hydrogen (LCOH) drops. The valuation is highly dependent on the timing of government subsidies—such as production tax credits or carbon offsets—which are front-loaded in the DCF to bridge the gap until the plant reaches commercial parity with grey hydrogen.
WACC: Pricing Technology and Policy Risk
The Weighted Average Cost of Capital (WACC) for a green hydrogen project typically carries a higher “innovation premium” compared to traditional energy assets. Because the technology is still scaling and long-term historical data is sparse, equity investors demand higher returns to compensate for technical risks, such as electrolyzer degradation rates. While project financing can lower the WACC, the cost of debt is heavily tied to the creditworthiness of the “off-taker” (the entity buying the hydrogen). A WACC for a green hydrogen plant must also be dynamic; as the technology matures over the 20-year model, the discount rate may compress, reflecting the shift from a high-risk venture to a stabilized utility-like asset.
Sensitivity Analysis: Stress-Testing Power Costs and Efficiency
For a Green Hydrogen plant, Sensitivity Analysis is the most critical tool for identifying the “make-or-break” variables of the project—primarily the cost of renewable electricity and electrolyzer efficiency. Since power accounts for up to 60-80% of operating costs, a sensitivity table showing a $5/MWh change in electricity prices can reveal if the project swings from a massive NPV to a total loss. Additionally, analysts must stress-test the “capacity factor” (how often the plant actually runs) and the potential decline in hydrogen sale prices as the market becomes more competitive. This analysis ensures investors understand how sensitive the 20-year returns are to a world where carbon prices might rise—or where cheaper competing technologies might emerge.
Additional Notes
Levelized Cost of Hydrogen (LCOH) is often calculated to benchmark economic viability.
Sensitivity Analysis should test variables like hydrogen price, electricity cost, CapEx, and plant utilization.
Scenario Analysis may include regulatory changes, carbon pricing, or demand shifts.
Final Notes on the Financial Model
This 20-Year Green Hydrogen Plant Financial Model helps to focus on balancing capital expenditures with steady revenue growth from diversified distribution services. By optimizing operational costs, power efficiency, and maximizing high-margin services, the model ensures sustainable profitability and cash flow stability.
Download Link On Next Page
Download Link On Next Page