
Grocery Store Financial Model
This 5-Year, 3-Statement Grocery Store Financial Model in Excel includes revenue streams from Dairy to Frozen Produce, cost structures, and financial statements to forecast the financial health of your Grocery Store.
Financial Model for a Grocery Store
This financial model for a grocery store provides a comprehensive projection of the store’s financial health, covering revenue, expenses, cash flow, and profitability. The model typically includes Income Statement, Cash Flow Statement, and Balance Sheet, along with key assumptions and financial ratios.
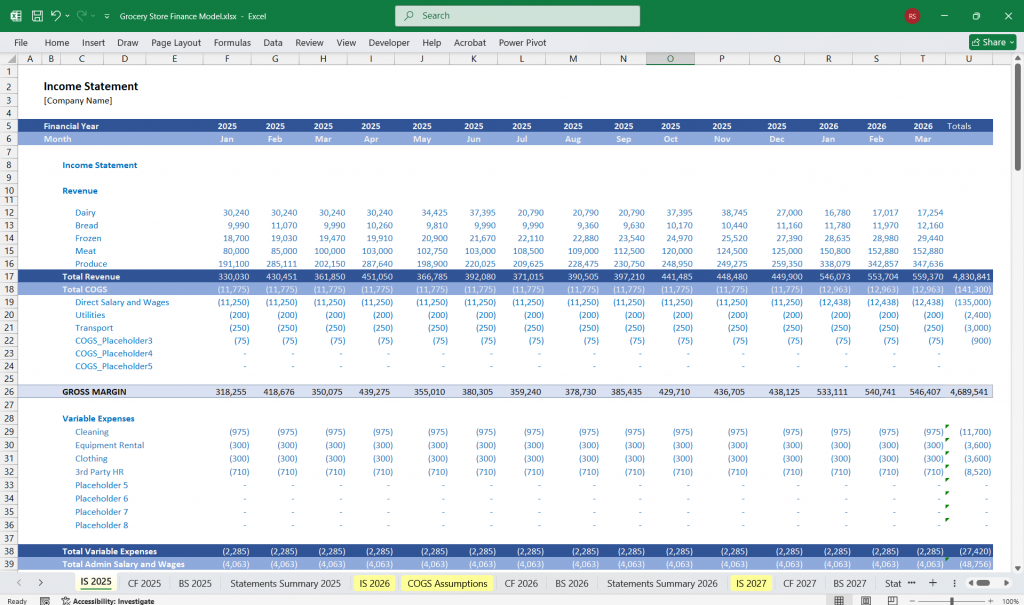
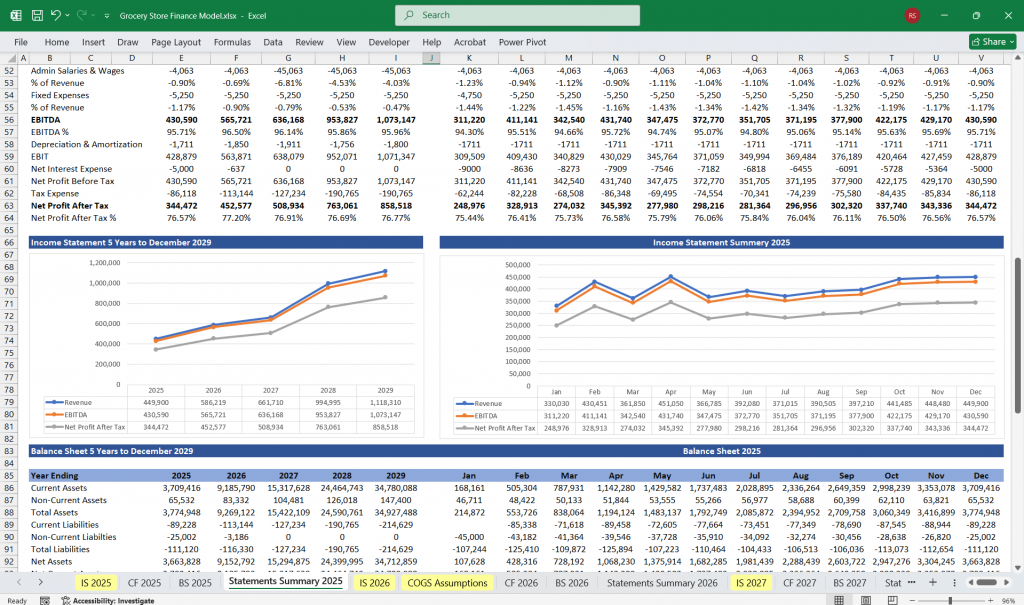
Income Statement (Profit & Loss Statement)
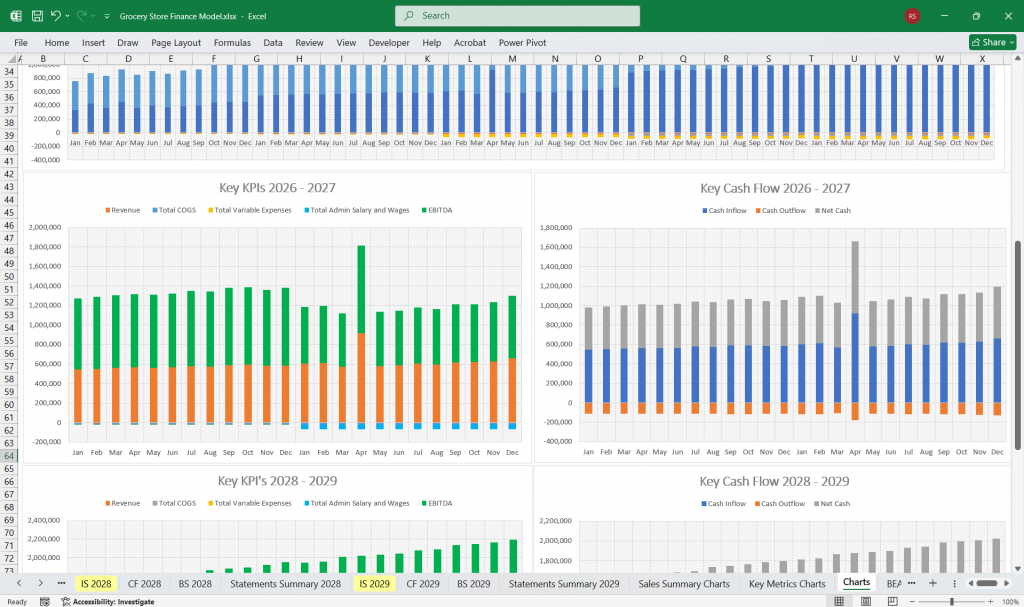
The income statement provides an overview of revenue, costs, and profitability over a specific period. It is structured as follows:
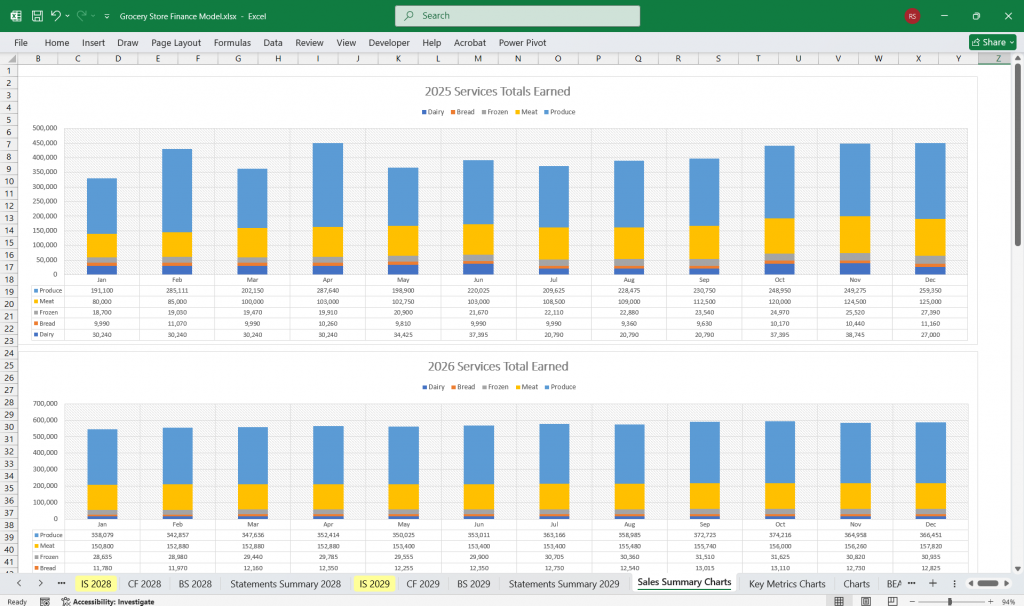
A. Revenue (Sales)
Product Sales Revenue
- Categorized by department: Produce, Dairy, Meat, Beverages, Frozen Foods, etc.
- Sales per product category (e.g., Fruits: $10,000/month, Meat: $15,000/month).
- Pricing strategy (e.g., markup percentages on cost).
Other Revenue Streams
- Delivery Services (if applicable).
- Loyalty Programs & Memberships (subscription revenue).
- Advertising Revenue (vendors paying for premium shelf placement).
B. Cost of Goods Sold (COGS)
- Purchases of Inventory
- Direct costs of inventory procurement.
- Freight, shipping, and handling.
- Shrinkage & Spoilage
- Percentage of inventory lost to waste or theft.
Gross Profit = Revenue – COGS
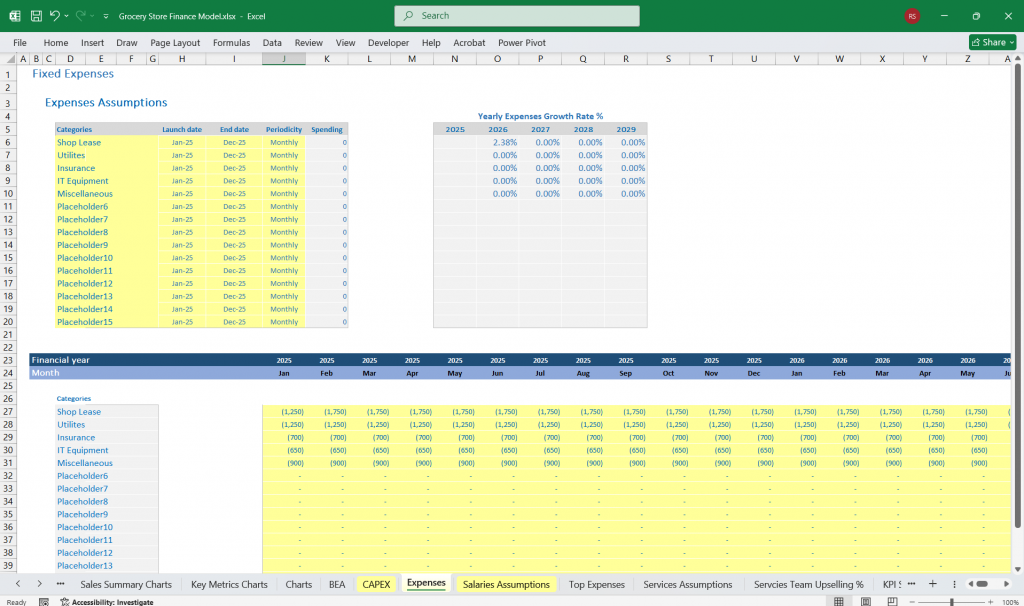
C. Operating Expenses
Personnel Costs
- Salaries & wages (cashiers, managers, stockers).
- Employee benefits & payroll taxes.
Rent & Utilities
- Store lease or mortgage.
- Electricity, water, internet, HVAC.
Marketing & Advertising
- Online and offline promotions, discounts, flyers.
Technology & Software
- POS systems, inventory management, accounting software.
Other Operating Costs
- Insurance, legal fees, bank charges.
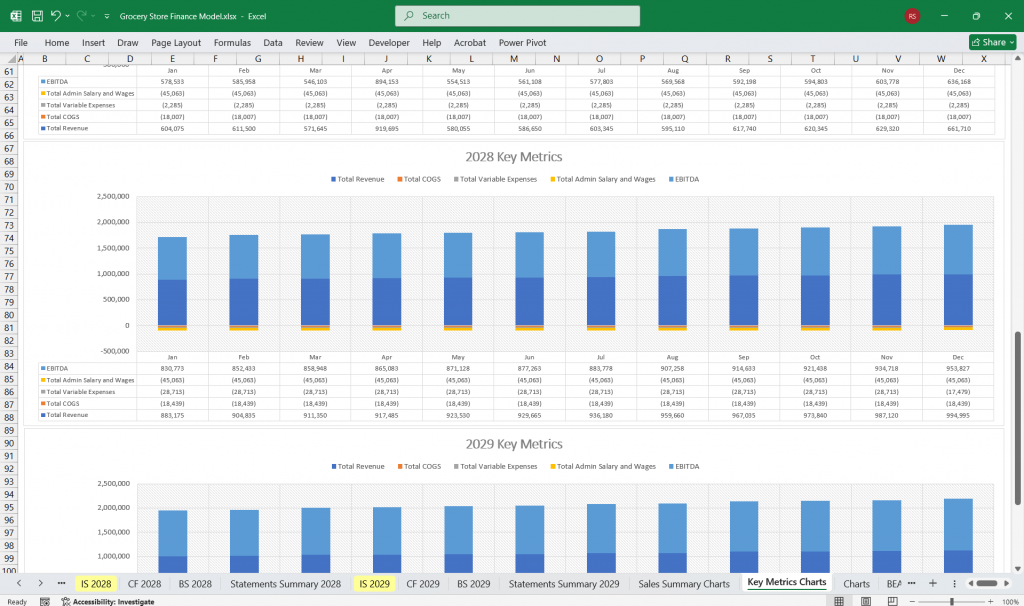
Operating Profit (EBITDA) = Gross Profit – Operating Expenses
D. Depreciation & Amortization
- Depreciation of store equipment (shelves, refrigerators).
- Amortization of intangible assets (franchise rights, goodwill).
E. Interest & Taxes
- Loan interest payments.
- Corporate income tax based on taxable income.
Net Profit (Net Income) = EBIT – Interest – Taxes
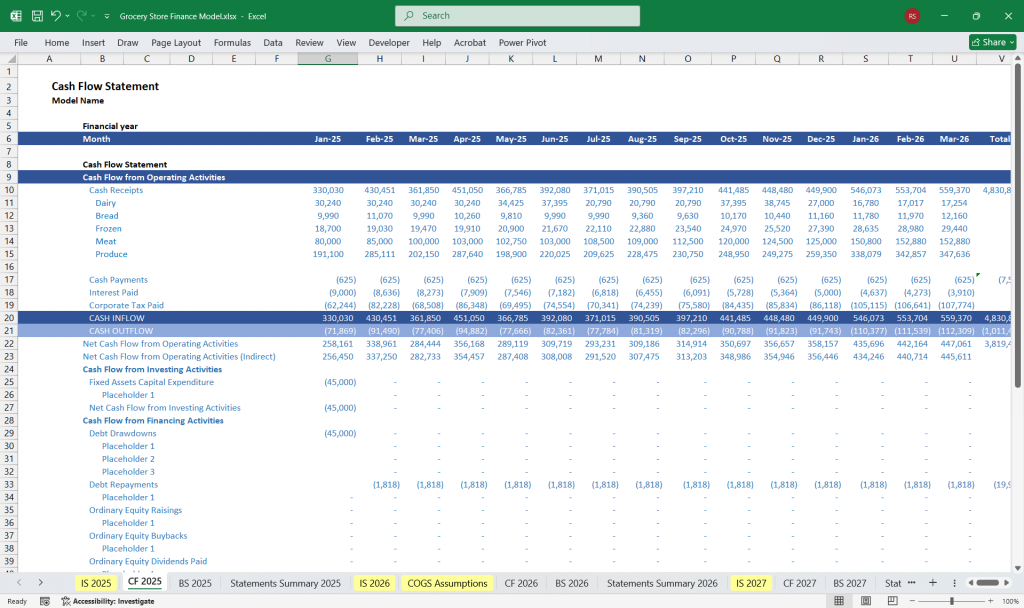
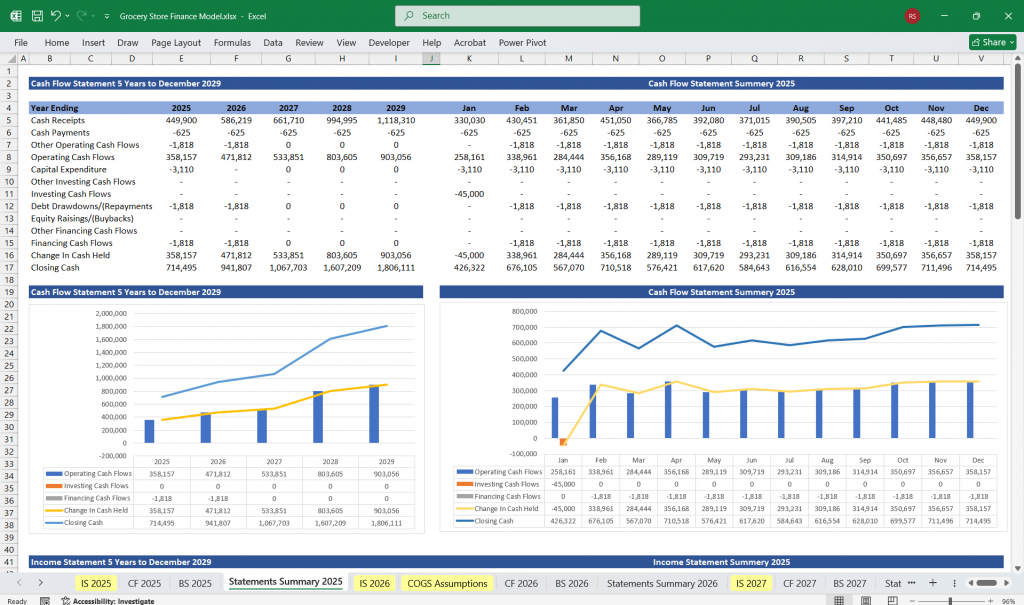
Cash Flow Statement
The cash flow statement tracks the movement of cash into and out of the business. It consists of three main sections:
A. Cash Flow from Operating Activities
Cash Received from Sales
- Cash and credit sales collected.
- Accounts receivable collections.
Cash Paid for Inventory
- Payments to suppliers and wholesalers.
Cash Paid for Expenses
- Salaries, rent, utilities, advertising, etc.
Taxes Paid
Net Cash from Operations = Cash Inflows – Cash Outflows
B. Cash Flow from Investing Activities
Purchase of Equipment
- Refrigerators, shelving, checkout systems.
Store Renovations & Expansions
- Remodeling or opening new locations.
Investments & Acquisitions
- Buying another store or shares in a supplier.
Net Cash from Investing Activities = Cash from Asset Sales – Cash Used for Investments
C. Cash Flow from Financing Activities
Loan Proceeds
- New loans taken for expansion.
Debt Repayments
- Loan repayments, lease liabilities.
Equity Contributions & Dividends
- Owner investments or shareholder dividends.
Net Cash from Financing Activities = New Borrowings – Debt Payments – Dividends
Net Increase (Decrease) in Cash = Operating Cash + Investing Cash + Financing Cash
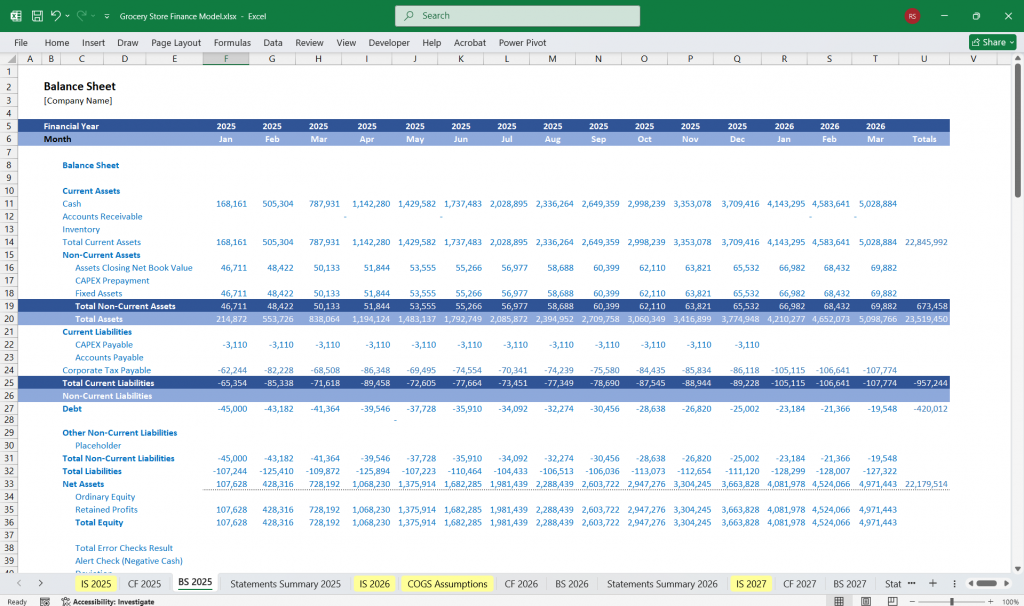
Balance Sheet
The balance sheet provides a snapshot of the grocery store’s financial position at a specific point in time, showing assets, liabilities, and equity.
A. Assets
Current Assets
- Cash & Cash Equivalents (operational funds).
- Accounts Receivable (credit sales awaiting payment).
- Inventory (groceries in stock).
- Prepaid Expenses (rent, insurance paid in advance).
Fixed Assets (Long-term Assets)
- Property, Plant, & Equipment (store, shelving, refrigerators).
- Accumulated Depreciation (deduction from fixed assets).
Intangible Assets
- Goodwill (brand reputation, customer loyalty).
- Software & patents (inventory management systems).
B. Liabilities
Current Liabilities
- Accounts Payable (unpaid invoices to suppliers).
- Short-term Loans & Credit Lines.
- Accrued Expenses (wages, utilities pending payment).
- Taxes Payable.
Long-term Liabilities
- Bank Loans (mortgages, equipment financing).
- Lease Obligations (for rental properties).
C. Owner’s Equity
- Owner’s Investment
- Initial and additional capital contributions.
- Retained Earnings
- Cumulative net income reinvested in the business.
Assets = Liabilities + Equity
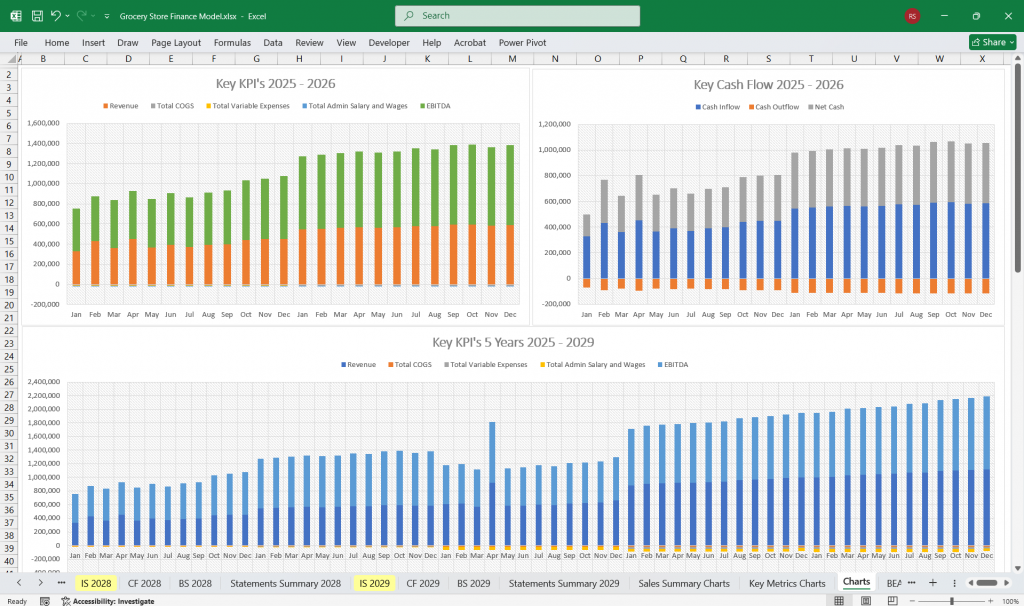
Key Financial Ratios & Metrics
To analyze the grocery store’s performance, key financial ratios include:
Profitability Ratios
- Gross Margin = (Gross Profit / Revenue) × 100
- Net Profit Margin = (Net Income / Revenue) × 100
Liquidity Ratios
- Current Ratio = Current Assets / Current Liabilities
- Quick Ratio = (Cash + Accounts Receivable) / Current Liabilities
Efficiency Ratios
- Inventory Turnover = COGS / Average Inventory
- Days Inventory Outstanding (DIO) = 365 / Inventory Turnover
Leverage Ratios
- Debt-to-Equity Ratio = Total Liabilities / Total Equity
- Interest Coverage Ratio = EBIT / Interest Expense
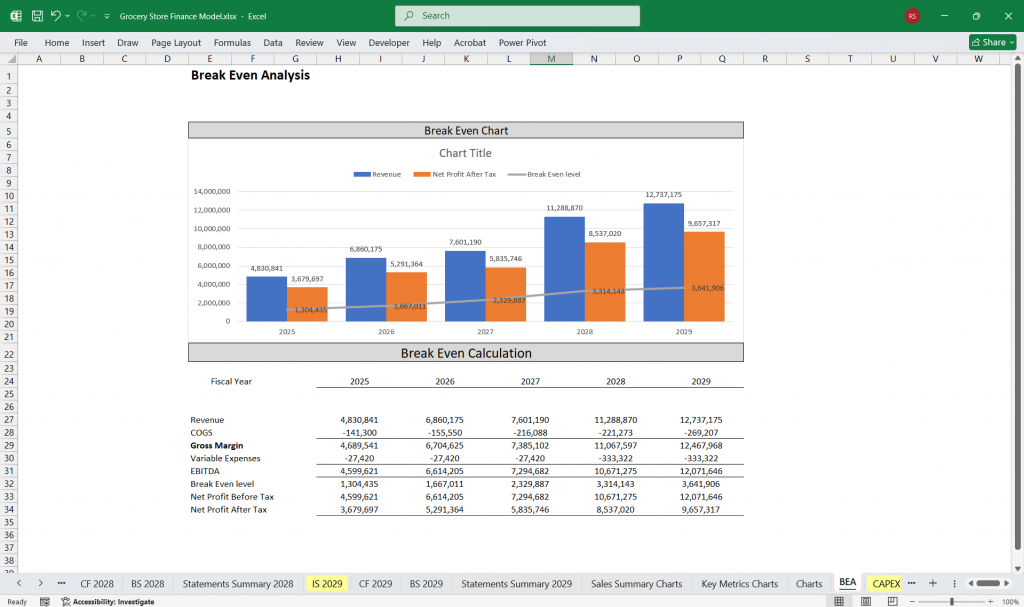
Conclusion
This Grocery Store Financial Model ensures accurate financial planning and decision-making. The income statement measures profitability, the cash flow statement ensures liquidity and the balance sheet provides financial stability insights. Regularly analyzing these statements helps store owners optimize costs, manage cash flow, and plan for growth.
Download Link On Next Page