Excel xls Financial Templates (User Guide)
If you purchase one of our 5, 10, or 20-year models, this Excel xls Financial Templates (User Guide) explains how to use our MS Excel templates. Inputs, reading and editing income and cash flow statements, COGS, and Expenses spreadsheets and their effects on balance sheet metrics.
Inputs Tabs And Financial Modeling
This guide is designed to help you build, analyze, and interpret robust financial models. It will walk you through your data inputting and explains how the tabs are connected, using clear and consistent formulas, and separating the inputs, calculations, and outputs. You will create a transparent, flexible, and error-resistant tool for forecasting, valuation, and informed decision-making. Always remember to document your assumptions, stress-test your model with scenario analysis, and meticulously audit your work to ensure accuracy and reliability.
All our Modeling downloads are a Three-Statement Model; these are the fundamental building blocks of corporate financial analysis and valuation. They are a dynamically integrated spreadsheet that connects a company’s three core financial statements—the Income Statement, Balance Sheet, and Statement of Cash Flows—through a series of logical formulas and links. These models’ primary purpose is to forecast a company’s future financial performance and position based on a set of defined operational and financial assumptions (e.g., revenue growth, margin profiles, working capital efficiency, and capital expenditure plans). Its power lies in the mechanical linkages that ensure the model is “circular” and self-balancing; a change in a single driver, like sales growth, automatically cascades through all three statements, updating net income, asset requirements, debt needs, and ending cash balance. This allows analysts, investors, and managers to perform scenario and sensitivity analysis, assess a company’s ability to generate cash, model its future financing needs, and ultimately value the business based on its projected free cash flows.
Income Statement:
Purpose: Shows the company’s financial performance over a specific period (e.g., a quarter or a year), summarizing revenues, expenses, and profitability.
Key Components: Starts with Revenue, subtracts Cost of Goods Sold (COGS) to calculate Gross Profit. Then subtracts Operating Expenses (OpEx) like SG&A and R&D to arrive at Operating Income (EBIT). After accounting for interest expense and other non-operating items, it arrives at Pre-Tax Income and finally Net Income.
Primary Link to Other Statements: Net Income is the crucial link. It flows into the Balance Sheet as an addition to Retained Earnings within Shareholders’ Equity and serves as the starting point for the Cash Flow from Operations section.
Cash Flow Statement:
Purpose: Details the actual movement of cash into and out of the business during the period, explaining the change in the cash balance on the Balance Sheet.
Key Components: Divided into three sections:
Operating Activities: Adjusts Net Income for non-cash items (e.g., depreciation, changes in working capital like accounts receivable and inventory) to calculate the cash generated from core operations.
Investing Activities: Tracks cash used for or generated from capital expenditures (CapEx) and the purchase or sale of long-term assets.
Financing Activities: Includes cash from issuing debt or equity, repaying debt, paying dividends, and repurchasing stock.
Primary Link to Other Statements: The net change in cash calculated in this statement is added to the beginning cash balance to arrive at the ending cash balance, which is the final line that must match the Cash & Equivalents asset on the Balance Sheet.
Balance Sheet:
Purpose: Provides a snapshot of the company’s financial position at a specific point in time, showing what it owns (Assets), what it owes (Liabilities), and the owners’ stake (Equity).
Key Components: Based on the fundamental accounting equation: Assets = Liabilities + Shareholders’ Equity.
Assets: Include Current Assets (e.g., Cash, Accounts Receivable, Inventory) and Long-Term Assets (e.g., Property, Plant & Equipment (PP&E)).
Liabilities: Include Current Liabilities (e.g., Accounts Payable, Short-Term Debt) and Long-Term Liabilities (e.g., Long-Term Debt).
Equity: Includes items like Common Stock and Retained Earnings.
Primary Link to Other Statements: It is the foundation that must balance. The prior period’s balance sheet is the starting point. The ending cash asset is fed from the Cash Flow Statement, and Net Income from the Income Statement flows into Retained Earnings within Equity.
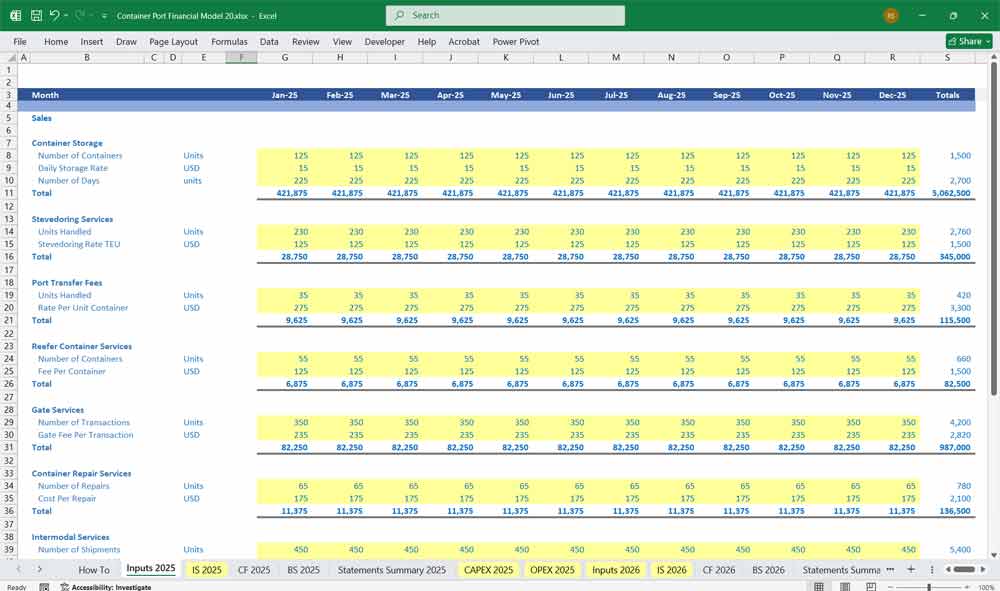
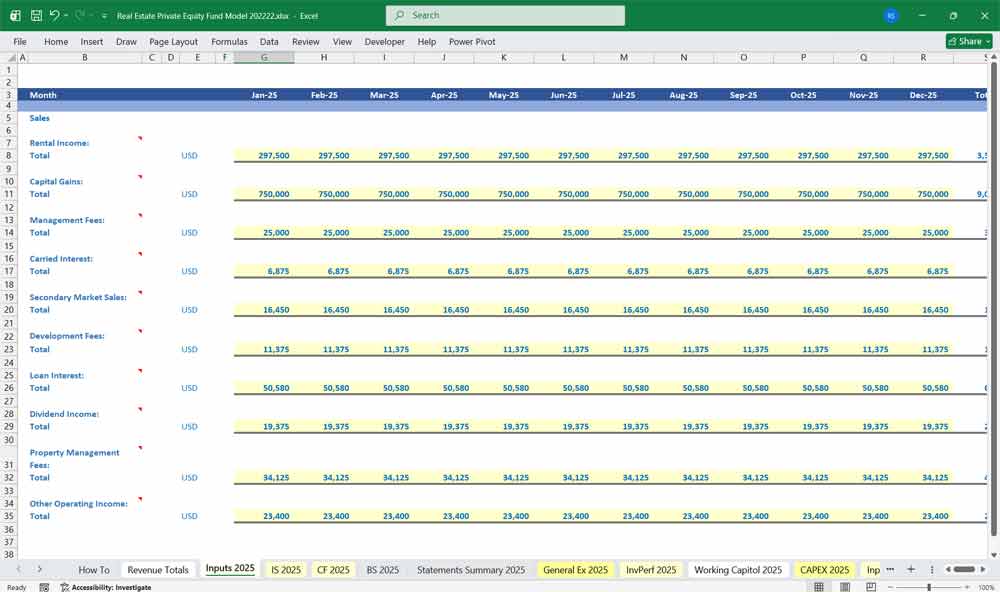
When opening the Workbook, depending on the model purchased, you will see data already entered as an example; some models have their own data “inputs” tabs for more details on revenue raising (see below).
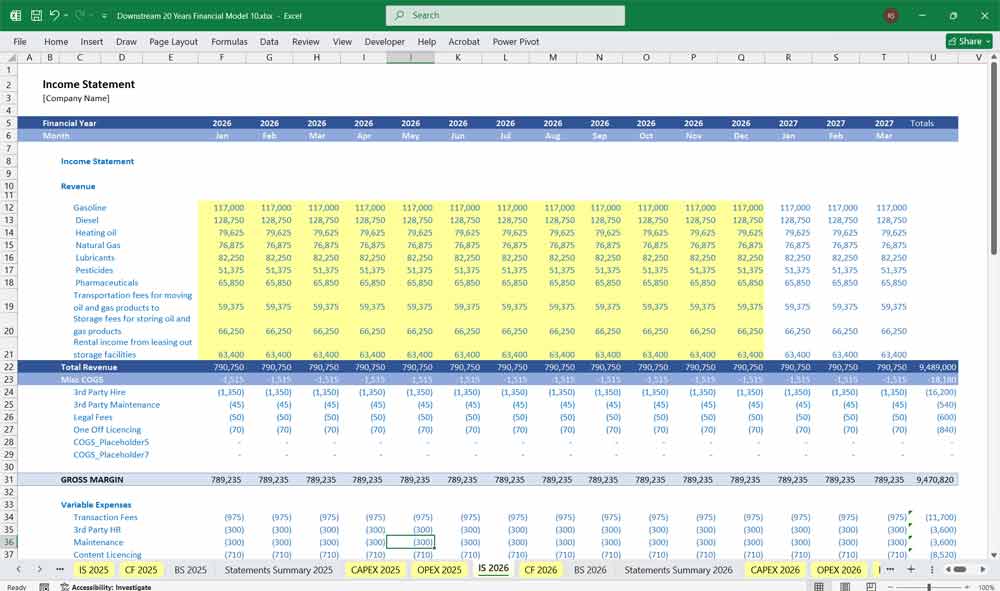
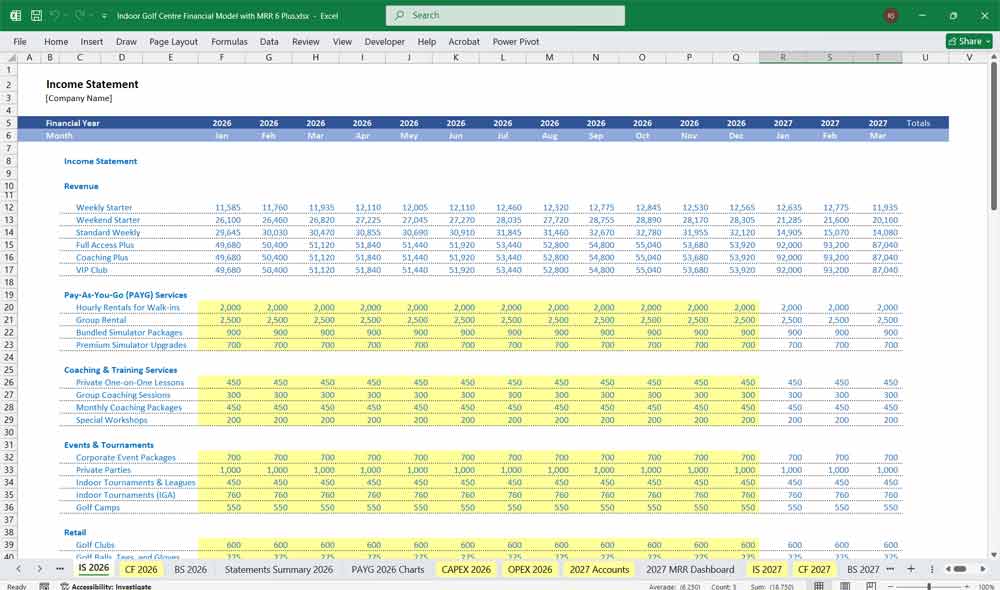
Financial Modeling & Income Statements
Differing models have various designs for the Income Statement , Input your revenue, cost of goods sold (COGS), and operating expenses from past financial statements into designated columns. The model below has its own tabs for “COGS” and “Expenses”. For instance, project revenue using growth rate drivers and calculate COGS as a percentage of revenue. This approach ensures models remain dynamic, transparent, and easily adjustable for scenario analysis.
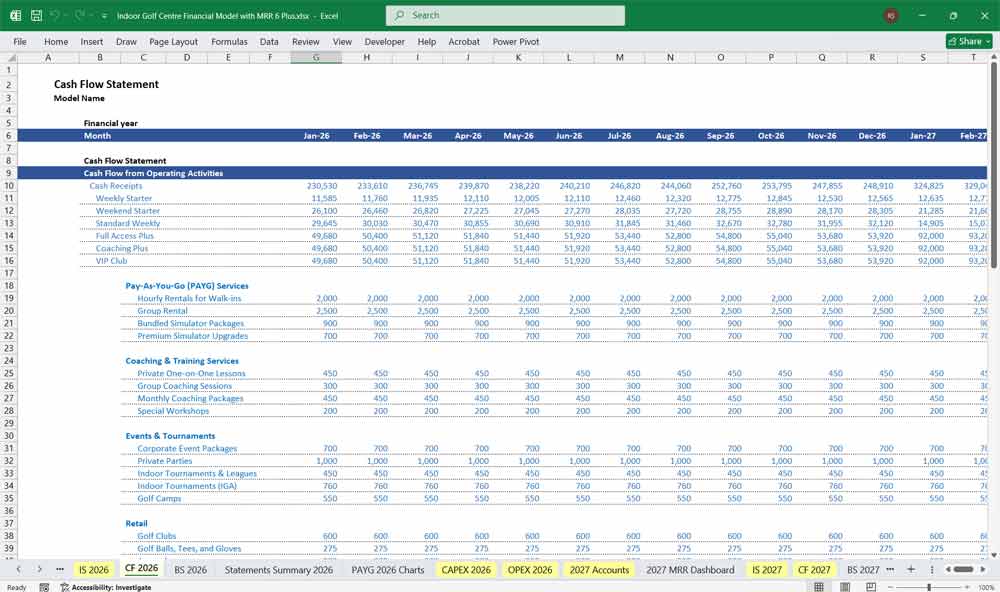
Financial Modeling and Cash Flow Statement Data
Cash Flow Statement revenues are automatically updated with the inputs entered into the Income Statement; you will have to enter your own metrics for “Cash Flow from Investing Activities”, “Cash Flow from Financing Activities”, “Debt Drawdowns”, and “Debt Drawdowns”. There is a separate section for “Cash Flow to Capital Providers”, “Cash Flow Available to Equity (CFAE)” within the model tab.
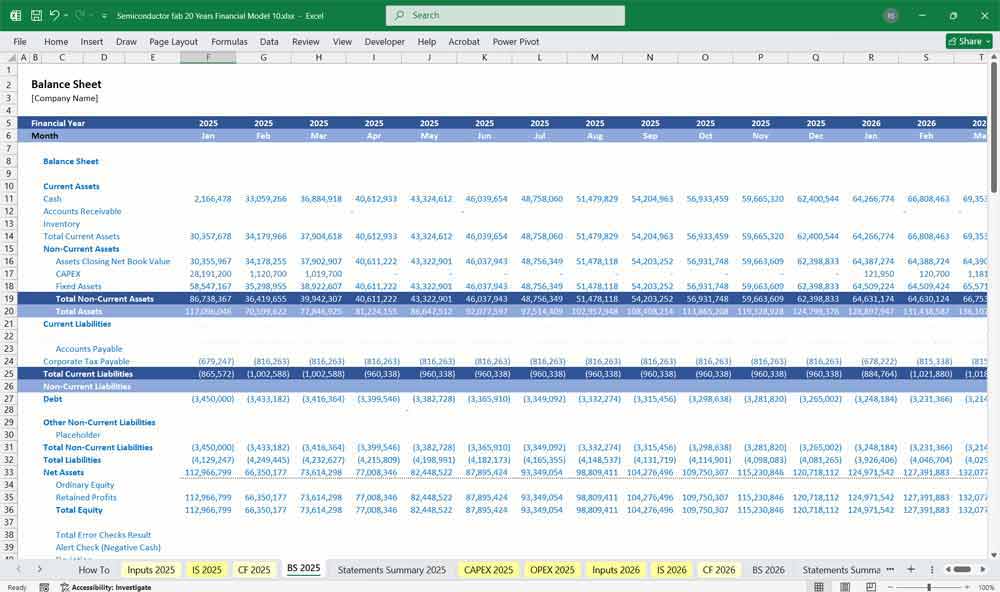
Financial Modeling And Balance Sheet Metrics
Calculated Metrics
Balance Sheets are automatically populated by the formulas within the Income and Cash Flow Statement, and serve as the critical check for accuracy and completeness, ensuring the entire model is logically sound. It is a dynamically generated snapshot of the company’s financial position at a period’s end, adhering to the fundamental equation: Assets = Liabilities + Shareholders’ Equity. Unlike a static report, its values are not entered directly but are instead calculated from other parts of the model; cash is fed from the Cash Flow Statement, retained earnings are updated with net income from the Income Statement, and debt balances are driven by financing activities. The modeler’s ultimate goal is for this statement to balance perfectly after every forecast period, validating that all operational, investing, and financing assumptions have been correctly integrated and that the model is mathematically cohesive.
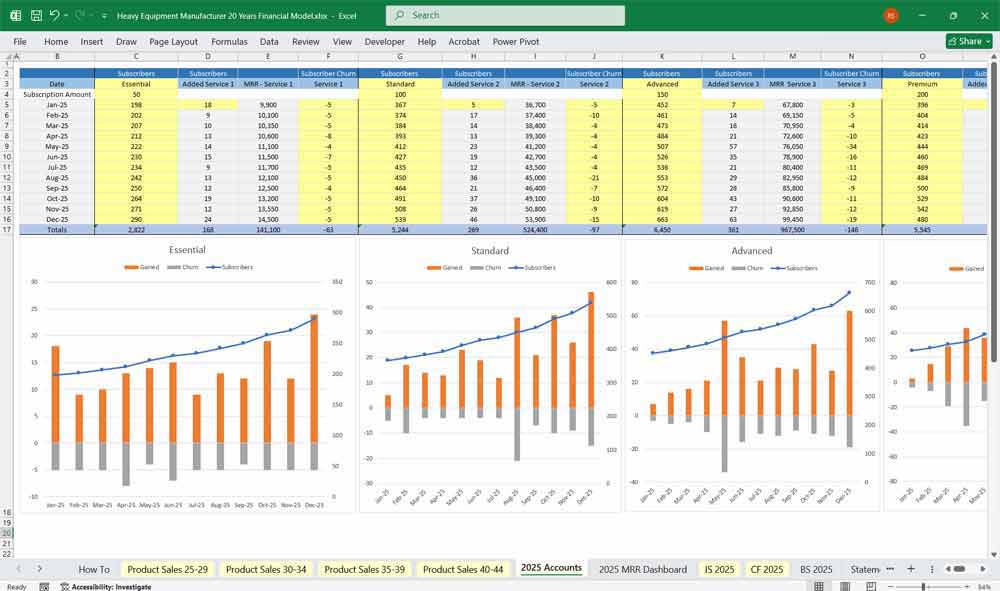
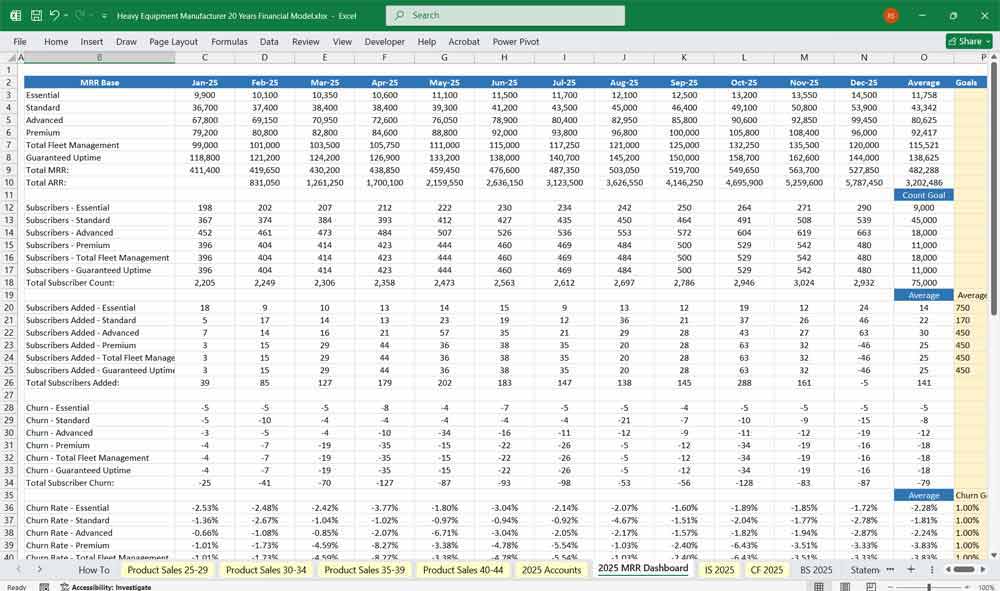
Financial Modeling (Adding 6-tier Subscriptions)
Some of our models come with a 4 or 6-tier subscription add-on, and more and more industry sectors are looking for the assurance of guaranteed income. Insurance companies are an obvious choice, but Medi Spas and even heavy equipment manufacturers with EaaS (Equipment as a Service) are now offering that option.
If you purchase a template with a subscription option when clicking the “accounts” tab this is what you will see. Enter your details into the yellow cells. To monitor your gained revenues, subscribers, and churn rate view the “dashboard” tab (picture 2).
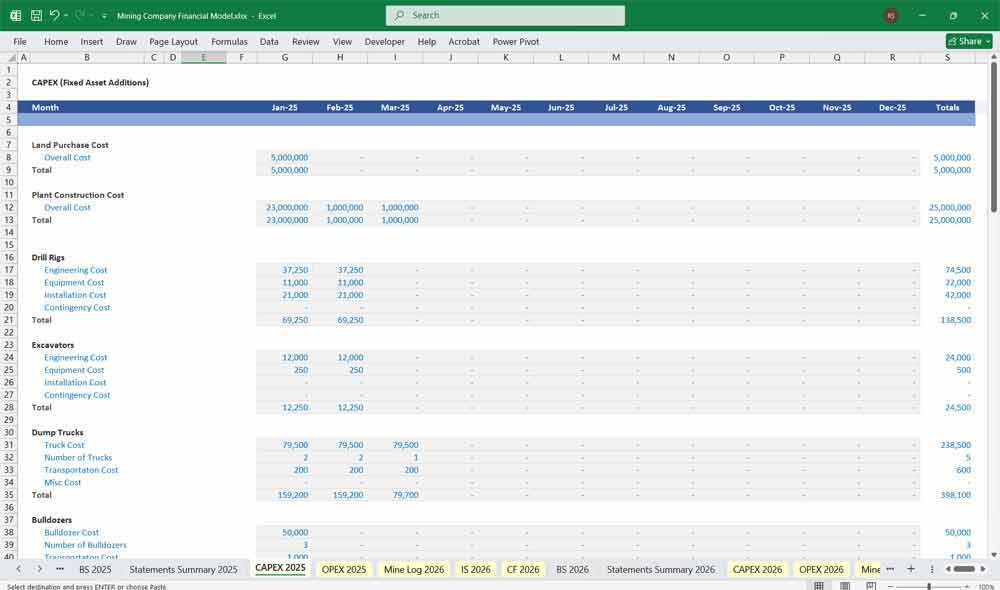
CAPEX Spreadsheets In Financial Modeling
Capital Expenditure (CAPEX) spreadsheet is a dedicated schedule that meticulously forecasts a company’s investments in long-term productive assets, such as property, plant, and equipment (PP&E). It serves as a critical link between strategic planning and financial projections by detailing the timing, cost, and useful life of each major asset purchase. The outputs of this schedule directly feed into three core statements: the depreciation expense flows to the Income Statement, the gross PP&E additions impact the Balance Sheet, and the total cash spent on CAPEX is a key component of Cash Flow from Investing Activities.
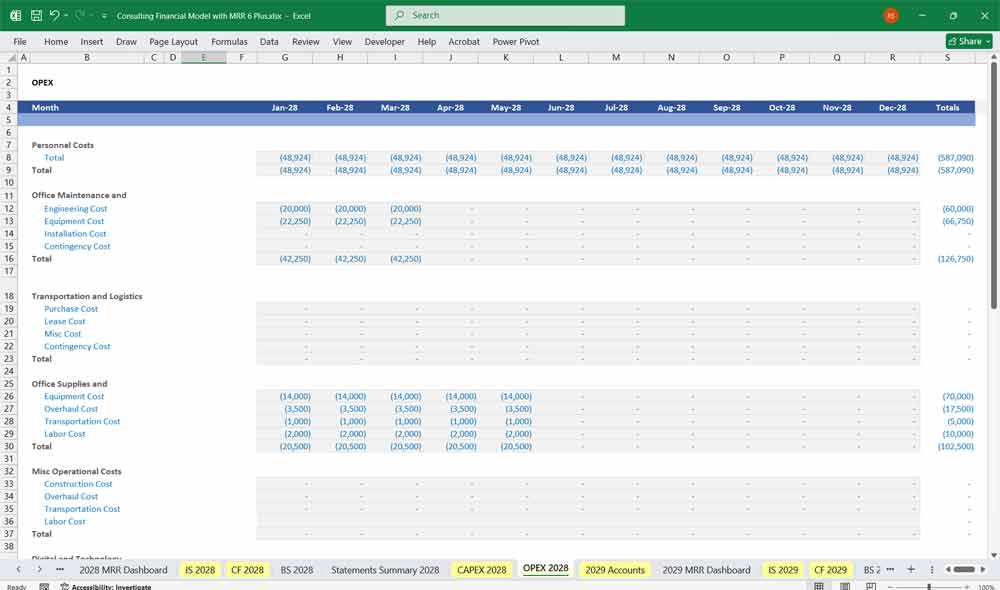
Separate OPEX Spreadsheets in Financial Modeling
The Operating Expense (OPEX) spreadsheet tab is a schedule that forecasts the ongoing costs required to run a business, excluding those directly tied to production. This includes expenses such as salaries, administrative (SG&A) costs, research and development (R&D), and marketing. Rather than using a single growth rate, the OPEX tab can be used to project careful modeling and its key drivers, such as linking salaries to headcount growth, rent to square footage, or marketing spend to a percentage of revenue. This driver-based approach provides a more nuanced and accurate forecast. The outputs from this schedule flow directly into the Income Statement, significantly impacting operating income and, ultimately, net profit. By isolating these assumptions, the model maintains transparency, allows for detailed analysis of cost efficiency, and enables easy adjustment to test different operational strategies.
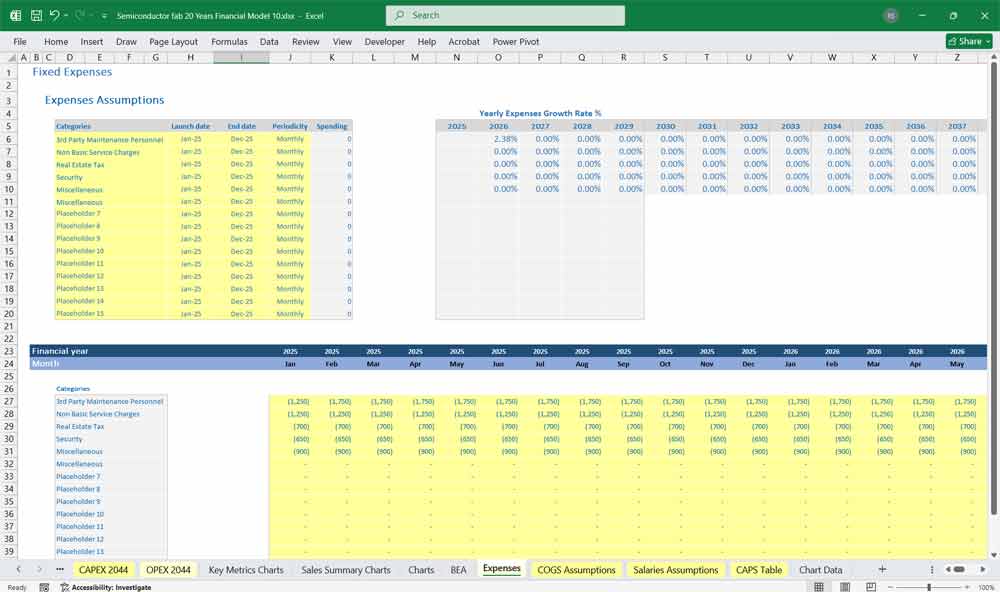
Fixed Expenses Tabs And Accurate Financial Modeling
In our financial modeling templates, we separate “fixed expenses” and “OPEX” (operating expenses), although they are related and describe different aspects of a cost. OPEX is a broad category encompassing all operating expenses—including selling, general, and administrative (SG&A) costs and R&D—that are not directly tied to production (which is COGS). It is a classification of purpose on the income statement. Fixed expenses, conversely, are a classification of cost behavior and form a subset of OPEX (and sometimes portions of COGS). They are costs that remain constant in total, regardless of business activity or sales volume, such as base rent, salaried personnel, and insurance. The key distinction is that OPEX can contain both fixed and variable cost behaviors; for example, while rent within OPEX is fixed, sales commissions within OPEX are variable. Therefore, while all fixed expenses are typically OPEX, not all OPEX is fixed. A robust model separates costs by both their purpose (OPEX vs. COGS) and their behavior (fixed vs. variable) to enable accurate forecasting and sensitivity analysis.
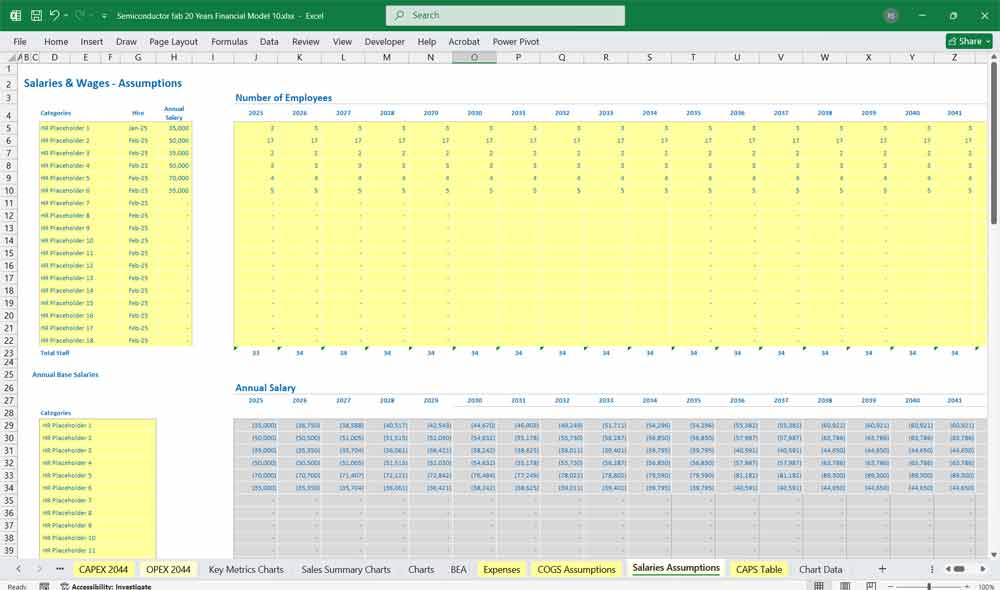
Financial Modeling And Dedicated Salary Spreadsheets
We incorporate a separate Salaries tab in our financial models as this significantly enhances their accuracy, transparency, and flexibility. This dedicated schedule allows for the detailed modeling of the entire wage expense by aggregating individual employee or departmental data, including base salaries, planned headcount changes, and the application of a specific annual percentage increase. Crucially, it also provides a structured place to accurately forecast variable components like monthly bonuses, which might be tied to performance metrics rather than simple salary. By isolating these detailed assumptions, the modeler ensures that the total wages calculated flow precisely into the OPEX schedule and ultimately the income statement. This separation allows for effortless scenario testing—such as adjusting the annual raise percentage or bonus pool—and immediately seeing the impact on profitability without cluttering the core statements, thereby creating a more robust and auditable model.