
Green Hydrogen Desalination DCF Financial Model Template
DCF Financial Model for Desalination To Green Hydrogen
This Discounted Cash Flow (DCF) Financial Model for a Desalination to Green Hydrogen Plant is a comprehensive financial planning and valuation tool used to evaluate the economic feasibility and long-term profitability of an integrated hydrogen production facility that utilizes desalinated seawater and renewable electricity to produce green hydrogen.
The model forecasts the project’s financial performance over its 20-year lifecycle, including construction, commissioning, and operational phases. By projecting revenues, costs, capital expenditures, financing structures, and working capital requirements, the model calculates the present value of the project’s expected cash flows using a discount rate that reflects project risk and capital costs.
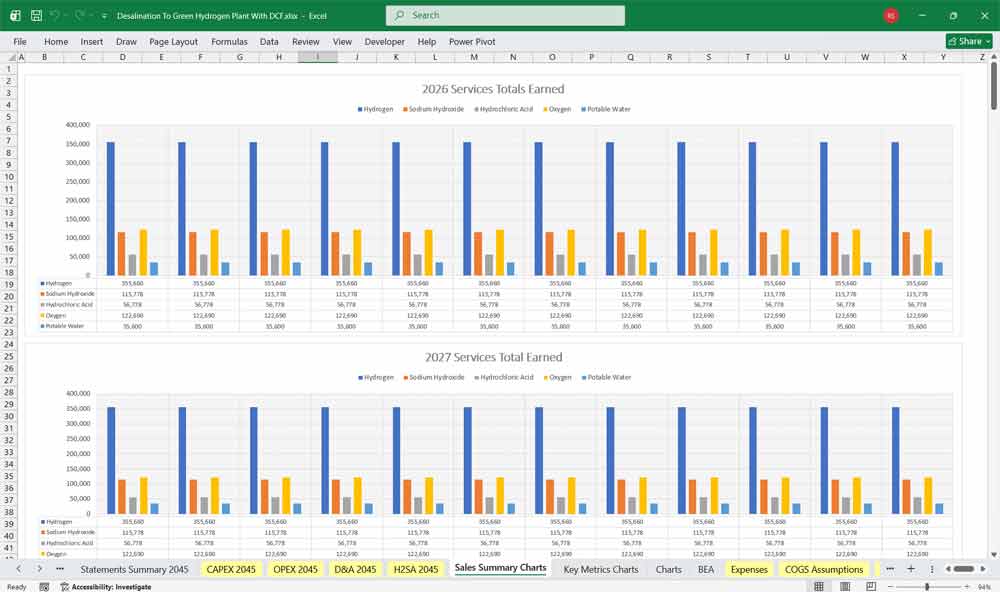
Revenue Model
Revenue in the model is primarily generated from hydrogen sales, though additional income streams may also be included.
Hydrogen Sales
Revenue is calculated using:
Hydrogen Production × Hydrogen Selling Price
Hydrogen prices may be based on:
Long-term offtake agreements
Market-based hydrogen price forecasts
Indexed pricing structures
Additional Revenue Streams
Depending on the project design, the model may include:
Oxygen byproduct sales
Carbon credits
Renewable energy certificates
Government subsidies or production tax credits
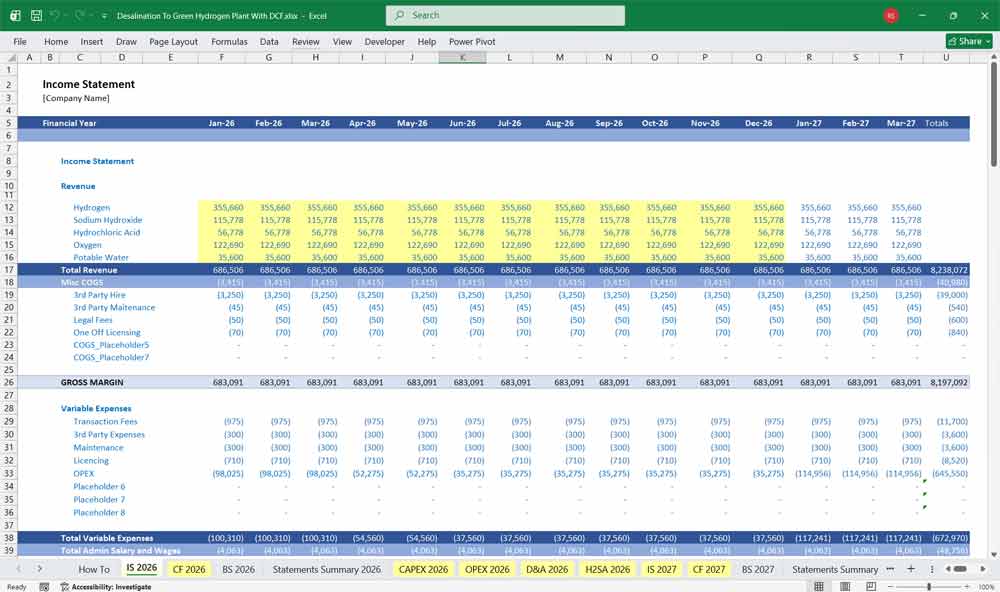
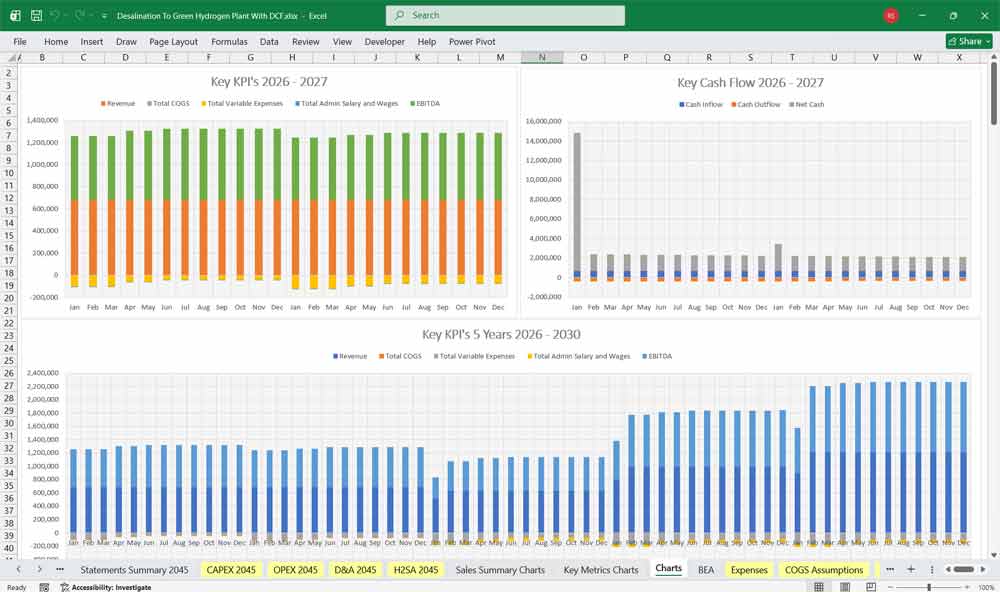
Income Statement
The Income Statement presents the operational profitability of the hydrogen plant over time.
Revenue
Total revenue is driven primarily by hydrogen sales.
Components include:
Hydrogen production volumes
Contracted hydrogen price
Additional revenue streams
Annual revenue is calculated based on projected production volumes and price escalation assumptions.
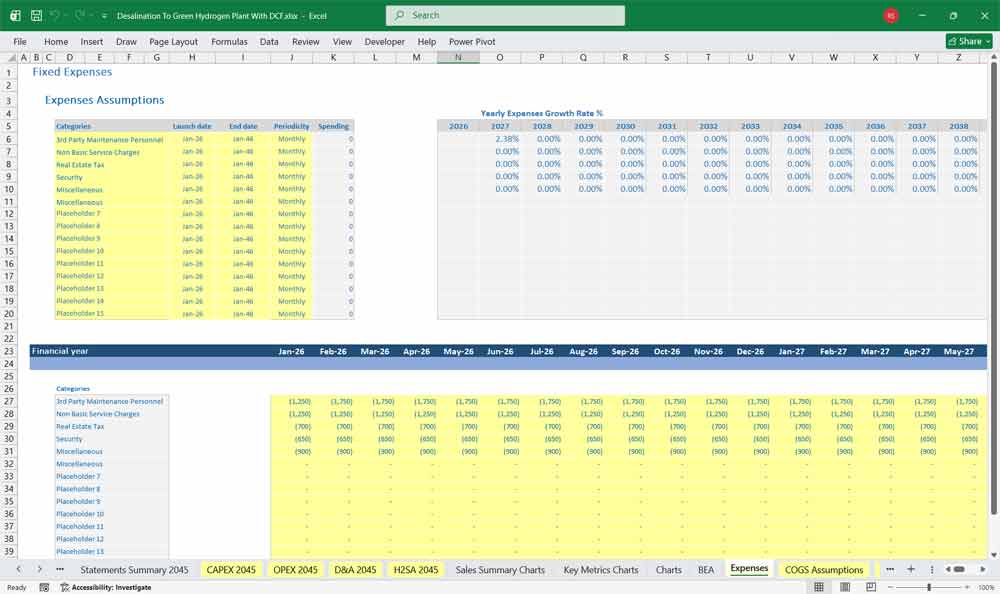
Operating Expenses (OPEX)
Operating costs include both variable and fixed expenses associated with plant operations.
Electricity Costs
Electricity represents the largest operating cost in most green hydrogen projects.
Costs include:
Electricity for electrolysis
Electricity for desalination
Electricity for hydrogen compression and storage
Electricity may be sourced from:
Dedicated renewable energy assets
Grid electricity
Power purchase agreements (PPAs)
Water and Desalination Costs
Water-related costs include:
Seawater intake
Reverse osmosis desalination
Water purification
Brine disposal
Energy consumption for desalination is also included in electricity costs.
Maintenance and Operations
Maintenance costs include:
Electrolyzer maintenance
Stack replacements
Mechanical and electrical maintenance
Spare parts
Labor and Administrative Costs
Personnel expenses include:
Plant operators
Engineers
Maintenance staff
Management and administration
Additional costs include insurance, regulatory compliance, and monitoring systems.
EBITDA
EBITDA represents the project’s operational earnings before depreciation, interest, and taxes.
EBITDA =
Revenue − Operating Expenses
This metric measures operational performance independent of financing and accounting adjustments.
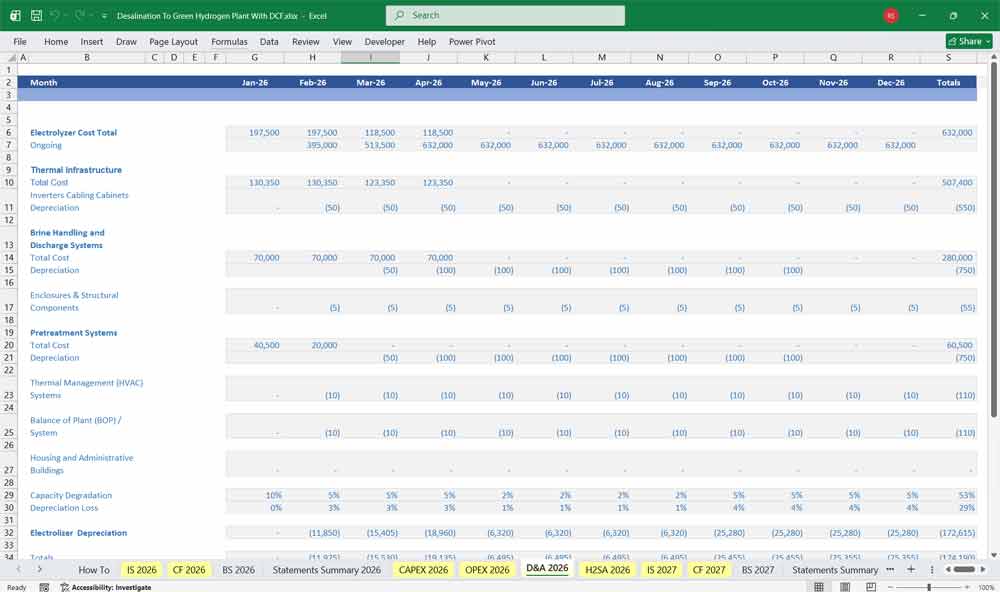
Depreciation
Capital investments in the hydrogen facility are depreciated over the useful life of the assets.
Typical asset lifetimes include:
Electrolyzers: 10–15 years
Desalination plant: 20–25 years
Compression and storage systems: 20 years
Infrastructure: 25–30 years
Depreciation may follow:
Straight-line depreciation
Tax depreciation schedules
EBIT
EBIT (Earnings Before Interest and Taxes) is calculated as:
EBIT = EBITDA − Depreciation
This reflects the plant’s operating profitability after accounting for asset wear and tear.
Interest Expense
Interest expenses are derived from the project’s financing structure, which may include:
Senior project debt
Construction loans
Green bonds
Infrastructure financing
Interest during construction is often capitalized as Interest During Construction (IDC).
Taxes
Corporate income taxes are calculated based on taxable income after accounting for:
Depreciation tax shields
Interest deductibility
Tax loss carryforwards
Government incentives
Net Income
Net income represents the final profit available to equity investors after all expenses.
Net Income =
EBIT − Interest − Taxes
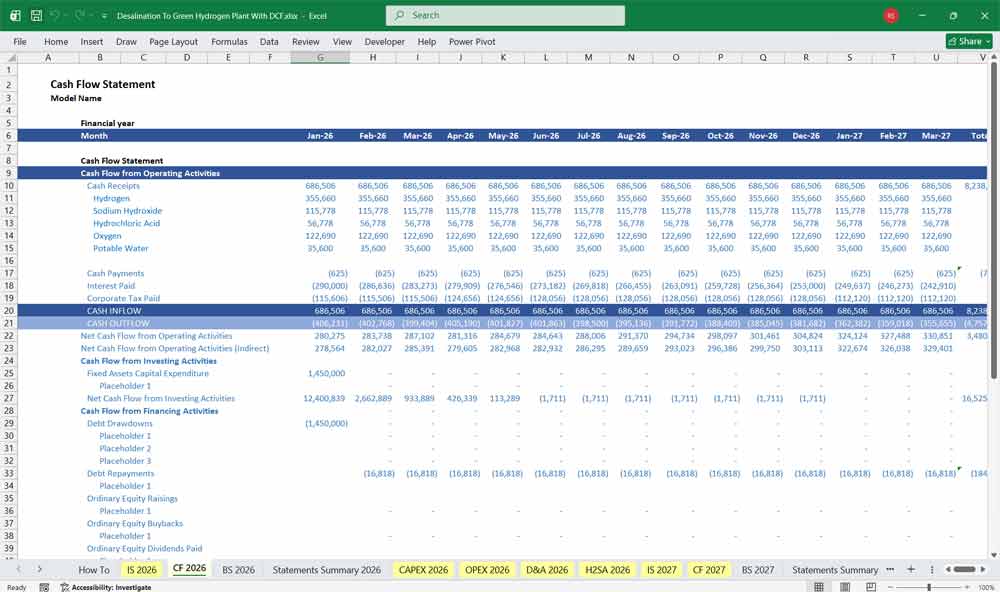
Desalination To Green Hydrogen Plant Cash Flow Statement
The Cash Flow Statement tracks the actual movement of cash into and out of the project company.
It is divided into three sections:
Operating Cash Flow
Investing Cash Flow
Financing Cash Flow
Operating Cash Flow
Operating cash flow reflects cash generated from plant operations.
It is calculated as:
Net Income
Depreciation
− Changes in Working Capital
Working capital components may include:
Accounts receivable from hydrogen buyers
Inventory (stored hydrogen)
Accounts payable to suppliers
Investing Cash Flow
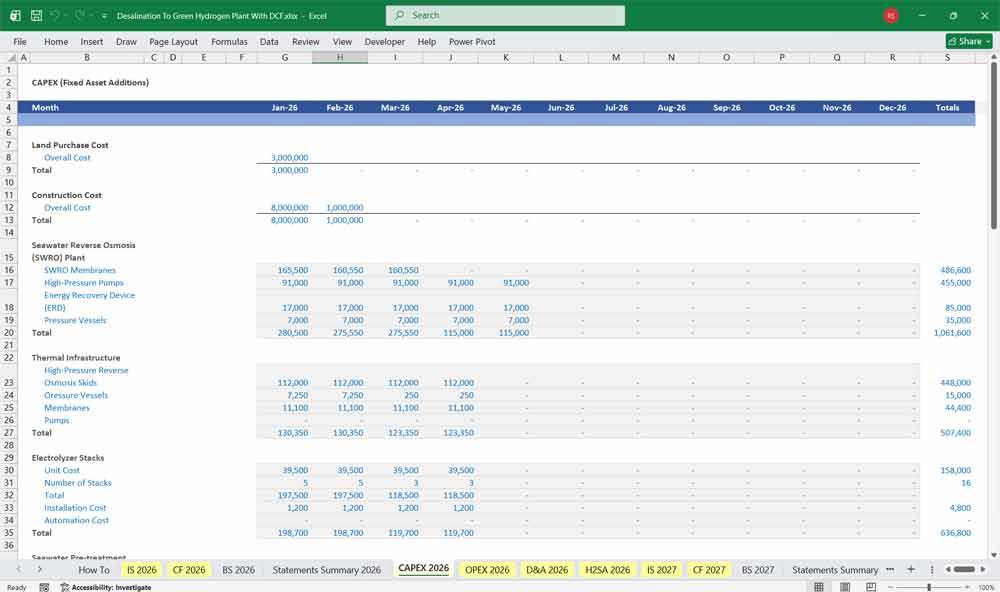
Investing cash flow captures capital expenditures related to the project.
Construction CAPEX
Major capital investments include:
Electrolyzer systems
Desalination plant
Hydrogen compression systems
Storage tanks
Pipelines and export infrastructure
Balance-of-plant equipment
CAPEX is typically distributed over the construction period according to a development schedule.
Replacement CAPEX
Electrolyzer stacks typically require replacement every 7–10 years, which is modeled as periodic replacement capital expenditure.
Financing Cash Flow
Financing cash flows reflect how the project is funded and how capital is returned to investors.
Debt Drawdowns
During construction, debt is drawn to finance capital expenditures.
Debt Service
During operations, the project repays debt through:
Principal repayments
Interest payments
Equity Contributions
Equity investors contribute capital to finance construction costs and maintain target leverage ratios.
Dividend Distributions
After meeting debt service requirements and reserve accounts, excess cash may be distributed to equity investors as dividends.
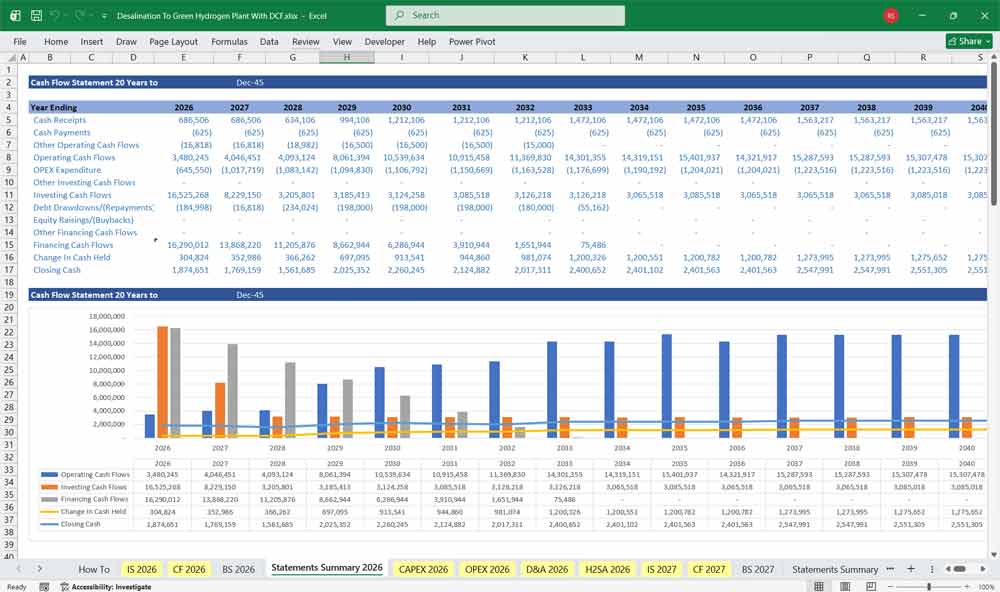
Free Cash Flow
The DCF model calculates free cash flow, which forms the basis for valuation.
Free Cash Flow to Firm (FCFF):
Operating Cash Flow − Capital Expenditures
These cash flows are discounted to present value using the project’s Weighted Average Cost of Capital (WACC).
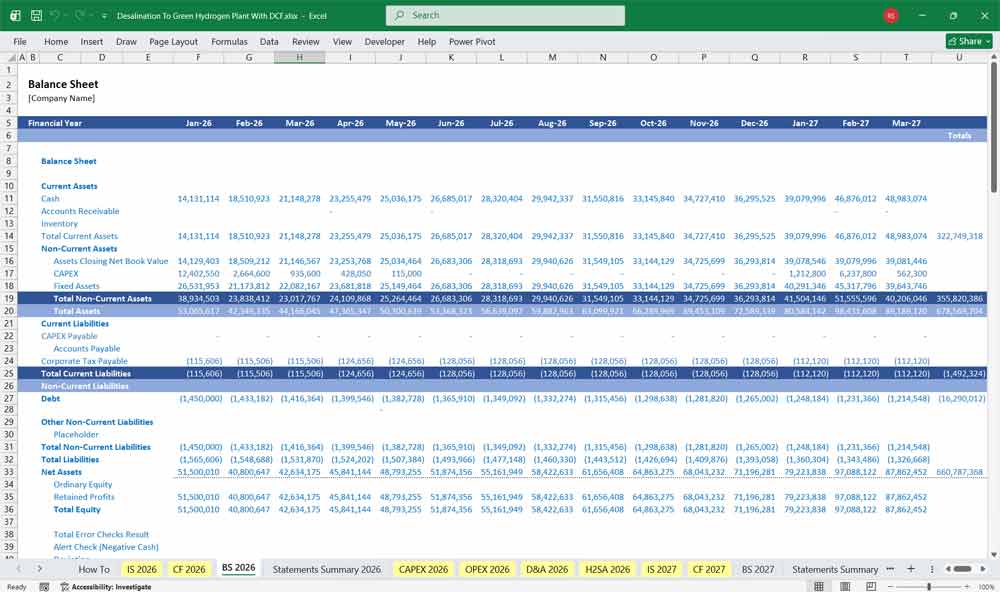
Desalination To Green Hydrogen Plant Balance Sheet
The Balance Sheet provides a snapshot of the project company’s financial position over time.
Assets
Fixed Assets
Fixed assets represent the capital investments in the hydrogen production facility.
These include:
Electrolyzers
Desalination plant
Hydrogen compression systems
Storage infrastructure
Power integration equipment
Buildings and land improvements
Net fixed assets are calculated as:
Gross Assets − Accumulated Depreciation
Current Assets
Current assets include:
Cash balances
Accounts receivable
Hydrogen inventory
Prepaid expenses
Liabilities
Long-Term Debt
Long-term liabilities include project financing instruments such as:
Senior project loans
Infrastructure debt
Green bonds
Debt balances decrease over time through scheduled principal repayments.
Current Liabilities
Short-term obligations include:
Accounts payable
Accrued operating expenses
Short-term portions of long-term debt
Equity
Equity represents the ownership interest in the project company.
Equity components include:
Initial equity contributions
Retained earnings
Additional equity injections
Dividend distributions
Balance Sheet Identity
The balance sheet ensures that:
Assets = Liabilities + Equity
This accounting identity ensures the financial integrity of the model.
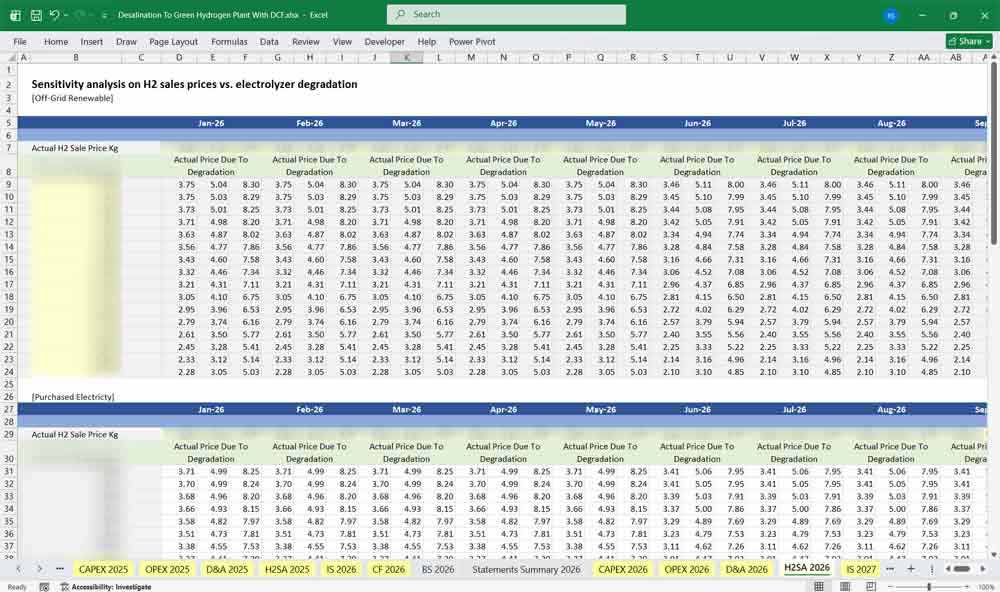
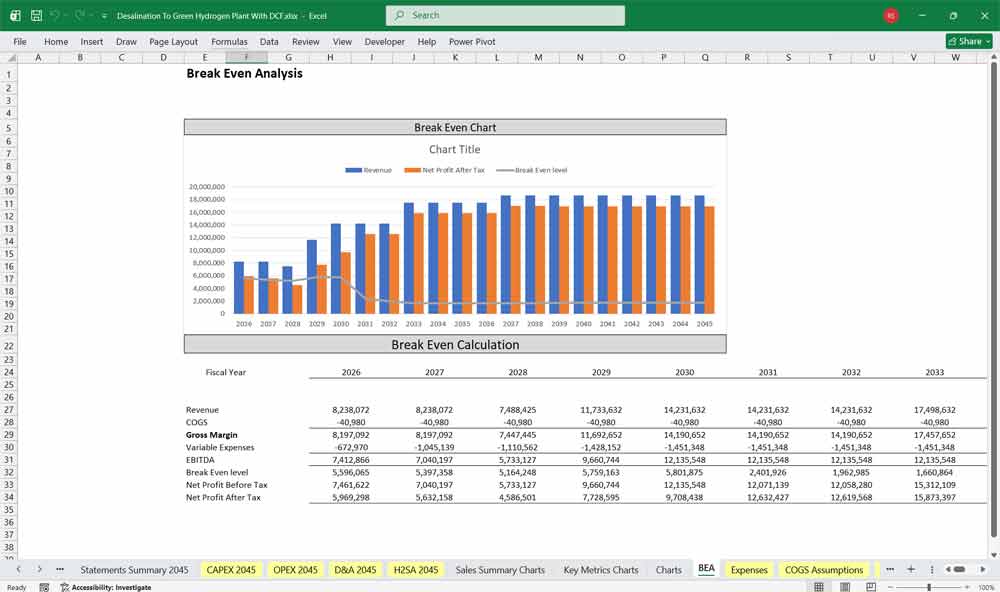
Desalination To Hydrogen Plant Sensitivity analysis on power prices vs. electrolyzer unit degradation
Sensitivity analysis in a desalination-to-green-hydrogen financial model is used to evaluate how changes in key technical and economic variables impact project profitability and cost of hydrogen production. Two of the most critical drivers are power prices and electrolyzer unit degradation, as electricity is typically the largest operating cost while electrolyzer efficiency directly affects hydrogen output. By varying these inputs within realistic ranges, the model can identify how sensitive metrics such as Net Present Value (NPV), Internal Rate of Return (IRR), and Levelized Cost of Hydrogen (LCOH) are to operational conditions.
Desalination To Hydrogen Plant Economics
Changes in power prices have a substantial impact on project economics because electrolysis requires significant electricity consumption. In a desalination-based hydrogen plant, electricity costs also include energy used for seawater desalination, purification, compression, and hydrogen storage. Sensitivity analysis often tests scenarios where electricity prices increase or decrease by a defined percentage (for example ±10–30%). Higher power prices significantly increase operating costs and the LCOH, potentially reducing project margins, while lower renewable electricity costs improve profitability and project competitiveness.
Desalination To Hydrogen Plant Electrolyzer Efficiency
Electrolyzer unit degradation represents the gradual decline in electrolyzer efficiency and hydrogen production capacity over time. As degradation increases, the electrolyzer requires more electricity to produce the same quantity of hydrogen, raising energy costs per kilogram of hydrogen. Sensitivity analysis typically models different degradation rates and replacement cycles for electrolyzer stacks. When degradation occurs faster than expected, hydrogen output declines and operating costs rise, negatively affecting cash flows and valuation metrics. Understanding the combined impact of power price volatility and electrolyzer degradation he
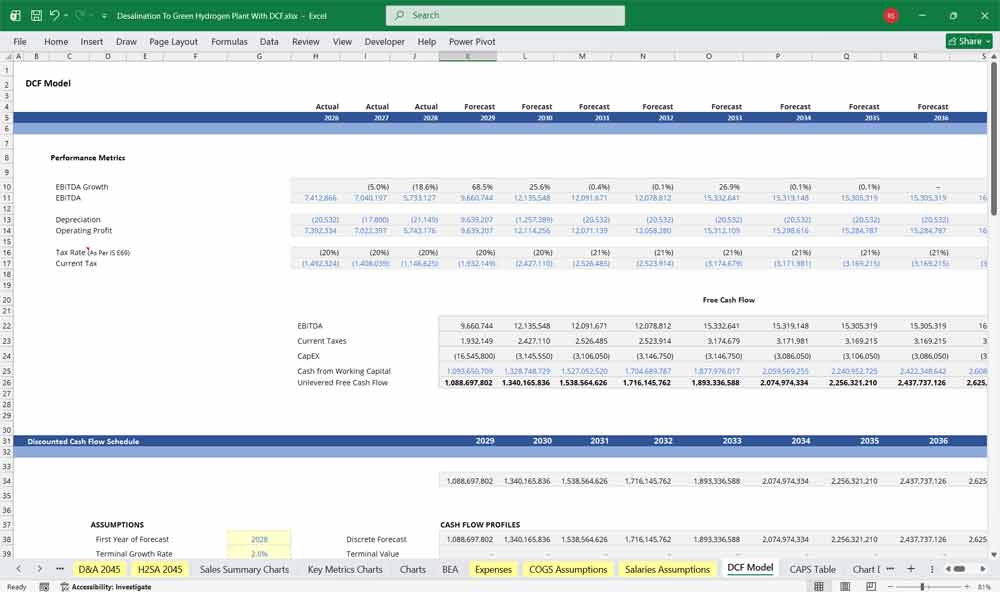
Valuing Your Desalination To Green Hydrogen Plant With A DCF
This Discounted Cash Flow (DCF) analysis is a core valuation method used to assess the economic viability of a desalination to green hydrogen plant. The DCF model estimates the present value of future cash flows generated by the project over its typical operational life, of 20 years. These cash flows are driven by hydrogen production volumes, hydrogen sales prices, electricity costs, desalination operating costs, and capital expenditures. By discounting projected free cash flows back to their present value, the DCF model allows investors and developers to determine whether the project generates sufficient returns relative to its initial investment.
Desal To H2O WACC
The Weighted Average Cost of Capital (WACC) represents the discount rate used in the DCF model and reflects the blended cost of financing from both debt and equity. In hydrogen infrastructure projects, WACC incorporates factors such as project risk, financing structure, interest rates on debt, and required returns from equity investors. Because desalination-to-hydrogen facilities involve large upfront capital investments in electrolyzers, desalination units, and supporting infrastructure, the cost of capital plays a significant role in determining project valuation. A lower WACC increases the present value of future cash flows and improves project economics, while a higher WACC reduces the overall project value.
Desalination To Green Hydrogen Plant Electrolyzer Analysis
Sensitivity analysis is used alongside the DCF model to evaluate how changes in key assumptions affect project returns. For a desalination to green hydrogen plant, important variables include electricity prices, hydrogen market prices, electrolyzer efficiency, plant capacity factor, and capital costs. By testing different scenarios and adjusting these inputs, developers can understand which variables have the greatest impact on Net Present Value (NPV) and Internal Rate of Return (IRR). This analysis helps identify key risks, supports investment decisions, and improves strategic planning for long-term hydrogen project development.
Final Notes On The DCF Financial Model
The model allows users to test how changes in key assumptions impact project returns.
Hydrogen selling price.
Electricity price.
Electrolyzer efficiency.
- Capacity factors
- Financing terms.
This 20-Year Desalination To Green Hydrogen Plant Financial Model helps to focus on balancing capital expenditures with steady revenue growth from diversified distribution services. By optimizing operational costs, power efficiency, and maximizing high-margin services, the model ensures sustainable profitability and cash flow stability.