
Data Analytics Financial Model
MS Excel developed Date Analytics Company Financial Model a structured framework to analyze the financial health of your Data Analytics company’s profitability. Offering Subscription and project-based revenues.
Financial Model for a Data Analytics Company
This data analytics company’s financial model involves projecting the company’s financial performance over a period of 5 years. The models include the three core financial statements: the Income Statement, Cash Flow Statement, and Balance Sheet. each component, tailored to a data analytics company.
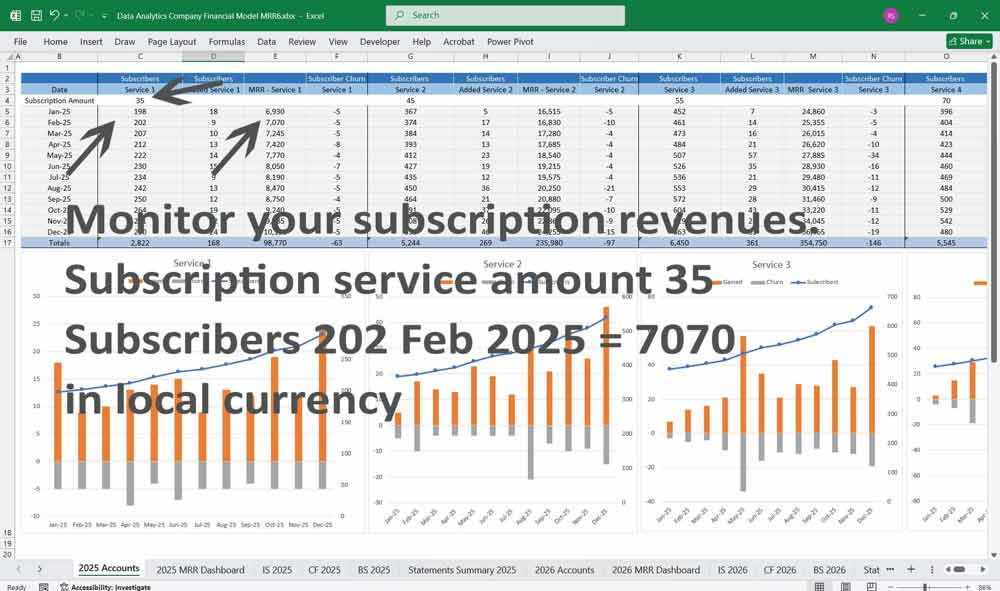
5-Year, 3 Statement model and revenues are raised from a 6 Tier Subscription ‘Managed Service Agreements’. Build Your MSA book as quickly as possible.
You would typically sell your services at tiered 12 month agreements that increase in price as SLAs (Service Level Agreements) and monthly hours scale upwards.
Plus 5 inputs for PAYG revenues.
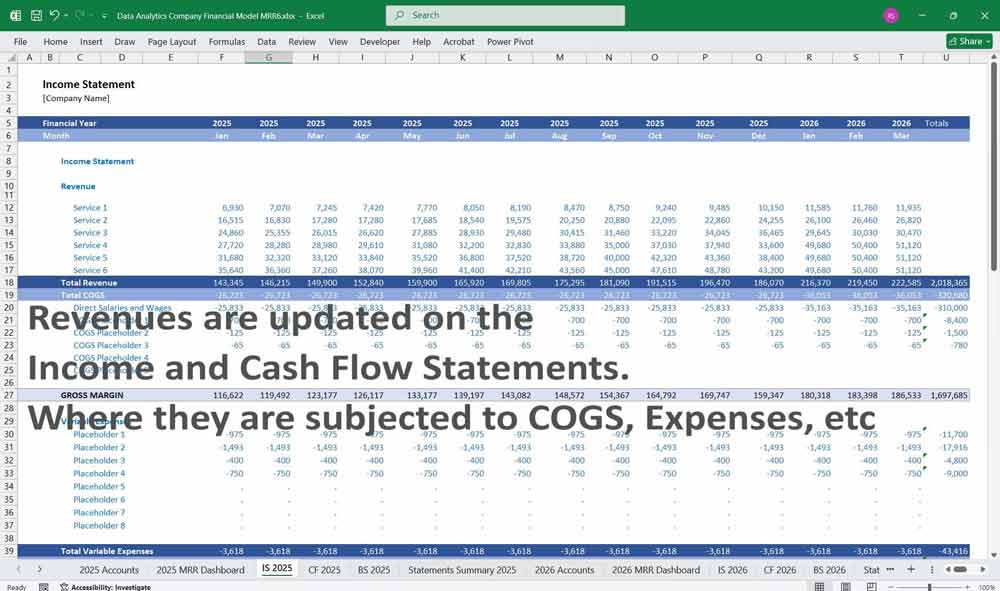
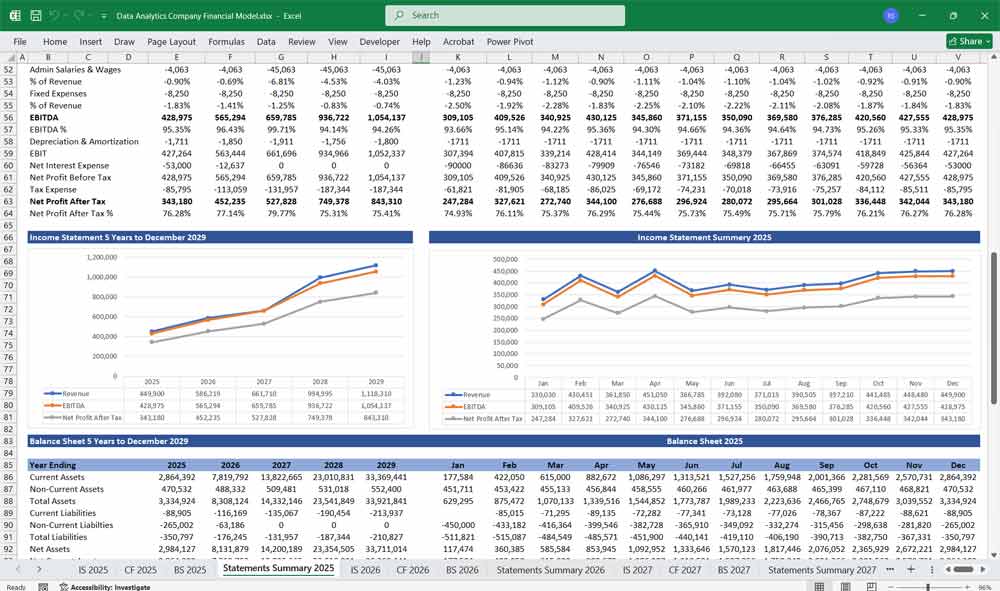
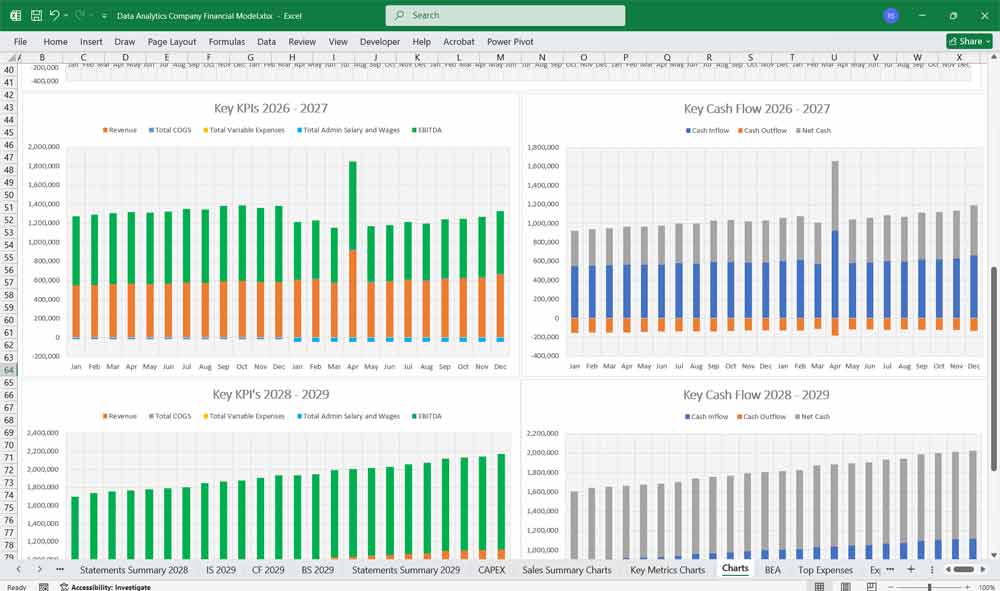
Income Statement
The Income Statement (or Profit and Loss Statement) shows the company’s revenues, expenses, and profitability over a specific period.
Key Line Items:
Revenue Streams:
Subscription Revenue: Recurring revenue from SaaS-based analytics platforms or tools.
Project-Based Revenue: One-time revenue from custom analytics projects or consulting services.
Licensing Revenue: Revenue from licensing proprietary algorithms, software, or data sets.
Support & Maintenance Revenue: Fees for ongoing customer support or software updates.
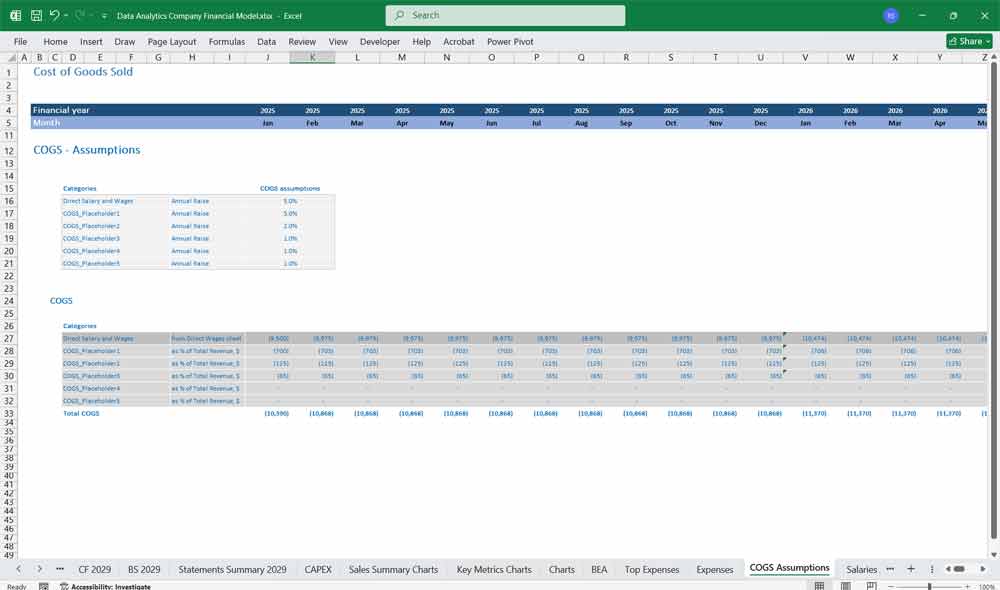
Cost of Goods Sold (COGS):
Cloud Hosting Costs: Expenses for cloud infrastructure (e.g., AWS, Azure, Google Cloud).
Data Acquisition Costs: Costs of purchasing or accessing third-party data sets.
Labor Costs for Delivery: Salaries of data scientists, analysts, and engineers directly involved in delivering services.
Software Licensing Costs: Fees for third-party tools or software used in analytics.
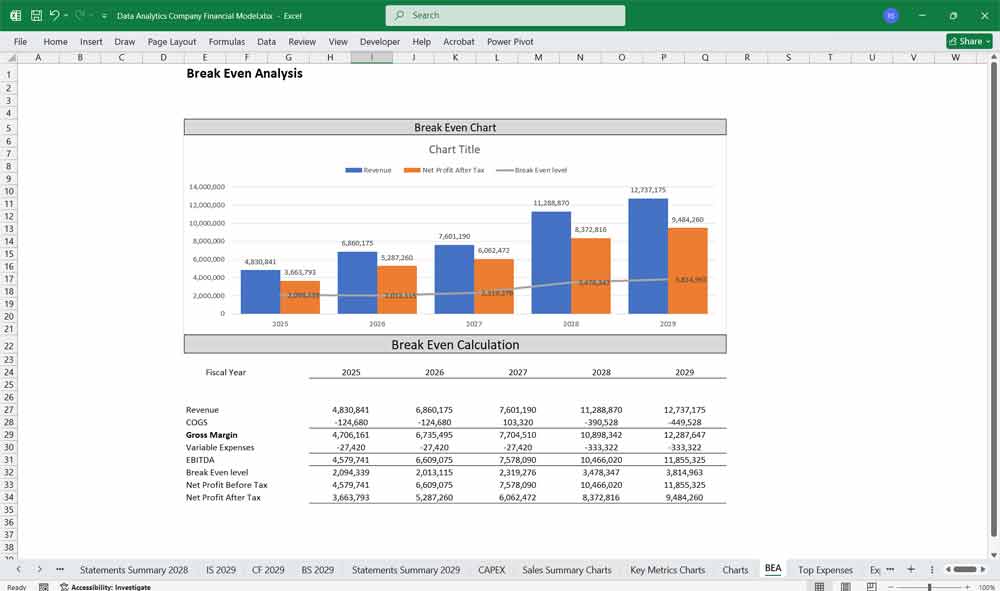
Gross Profit:
Calculated as Total Revenue – COGS.
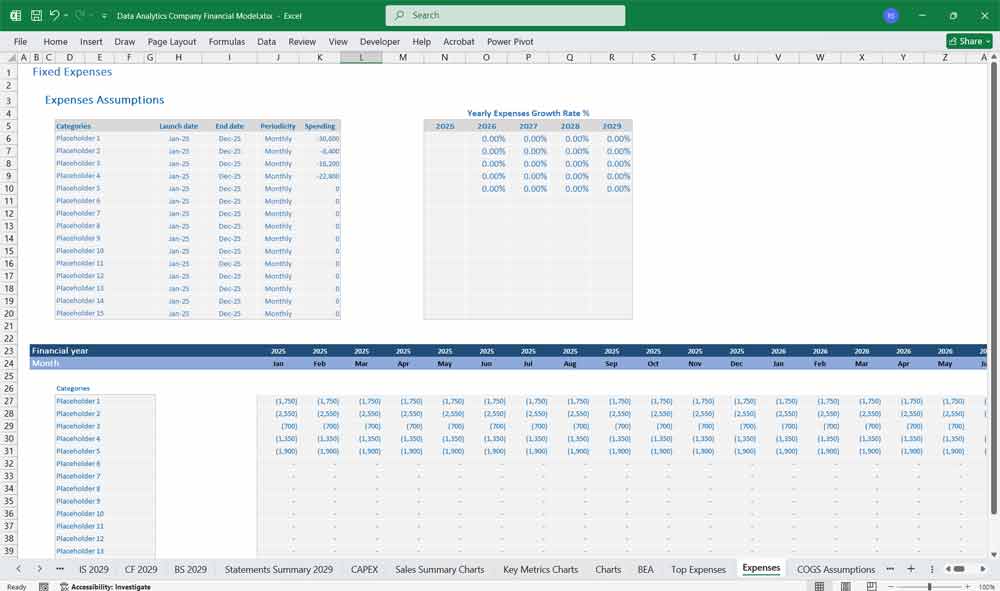
Operating Expenses:
Research & Development (R&D): Costs for developing new algorithms, tools, or features.
Sales & Marketing: Expenses for customer acquisition, advertising, and sales team salaries.
General & Administrative (G&A): Overhead costs like office rent, utilities, and administrative salaries.
Operating Income (EBIT):
Calculated as Gross Profit – Operating Expenses.
Interest Expense:
Interest on debt or loans.
Taxes:
Corporate income taxes based on applicable rates.
Net Income:
Calculated as Operating Income – Interest Expense – Taxes.

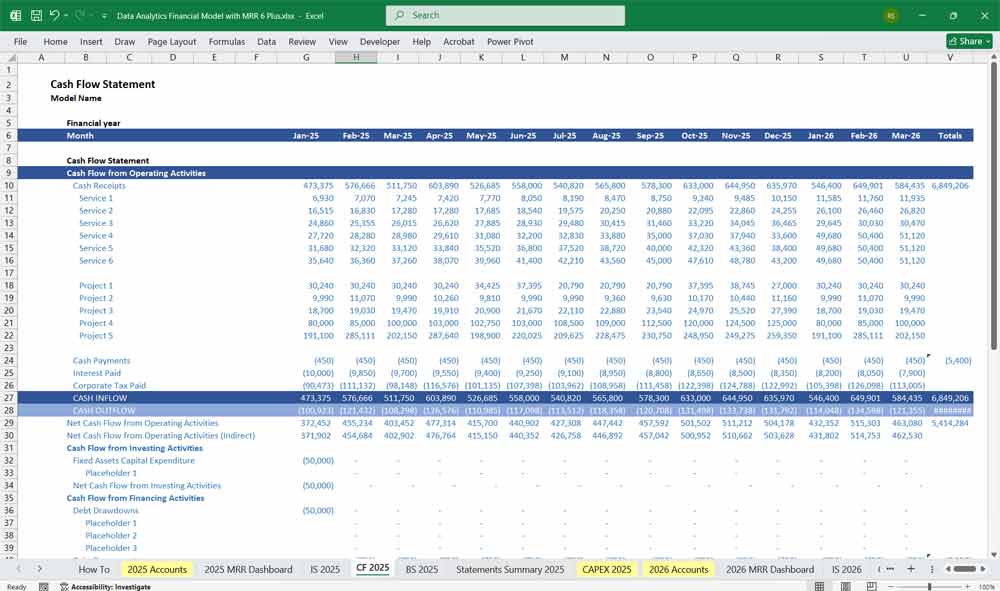
Data Analytics Financial Model Cash Flow Statement
The Cash Flow Statement tracks the company’s cash inflows and outflows, categorized into operating, investing, and financing activities.
Key Sections:
Operating Activities:
Cash Inflows:
Cash received from customers (subscriptions, projects, licensing).
Cash Outflows:
Payments for COGS (cloud hosting, data acquisition, labor).
Payments for operating expenses (R&D, sales & marketing, G&A).
Net Cash from Operating Activities:
Reflects the cash generated or used in core business operations.
Investing Activities:
Cash Outflows:
Capital expenditures (e.g., servers, hardware, software development).
Investments in data sets or intellectual property.
Cash Inflows:
Proceeds from the sale of assets or investments.
Net Cash from Investing Activities:
Reflects cash used for long-term investments.
Financing Activities:
Cash Inflows:
Proceeds from equity financing (e.g., venture capital, angel investors).
Proceeds from debt financing (e.g., loans, lines of credit).
Cash Outflows:
Repayment of debt principal.
Dividend payments (if applicable).
Net Cash from Financing Activities:
Reflects cash generated or used from financing.
Net Change in Cash:
Sum of net cash from operating, investing, and financing activities.
Ending Cash Balance:
Starting cash balance + net change in cash.
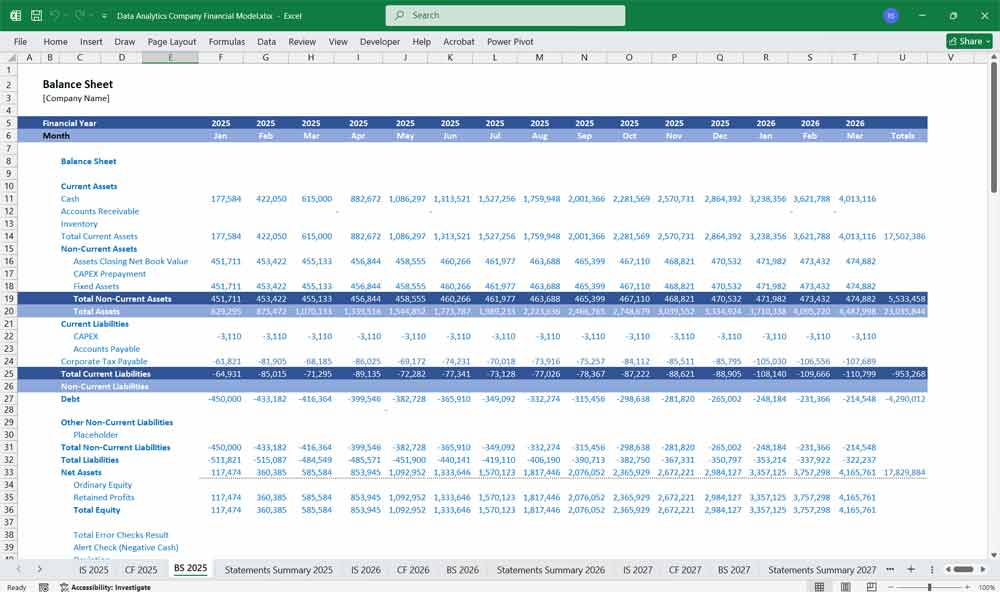
Data Analytics Financial Model Balance Sheet
The Balance Sheet provides a snapshot of the company’s financial position at a specific point in time, showing assets, liabilities, and equity.
Key Sections:
Assets:
Current Assets:
Cash and cash equivalents.
Accounts receivable (unpaid invoices from customers).
Prepaid expenses (e.g., annual software licenses).
Non-Current Assets:
Property, plant, and equipment (e.g., servers, office equipment).
Intangible assets (e.g., proprietary algorithms, patents).
Long-term investments (e.g., equity stakes in other companies).
Liabilities:
Current Liabilities:
Accounts payable (unpaid bills to suppliers).
Deferred revenue (payments received for services not yet delivered).
Short-term debt (e.g., lines of credit).
Non-Current Liabilities:
Long-term debt (e.g., term loans).
Lease obligations (e.g., office space leases).
Equity:
Common Stock:
Equity issued to shareholders.
Retained Earnings:
Cumulative net income retained in the business.
Additional Paid-In Capital:
Excess capital from equity financing.
Total Liabilities and Equity:
Must equal Total Assets to ensure the balance sheet balances.
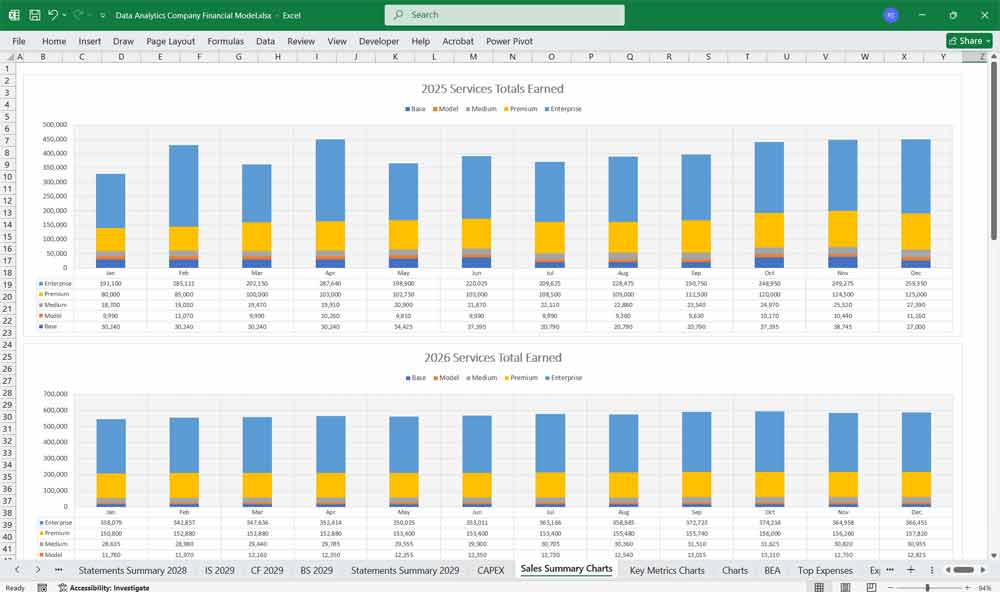
6-tier subscription model for a data analytics company
This financial model allows the business to cater to a wide range of customers, from small businesses to large enterprises, by offering varying levels of features, services, and pricing. Each tier is designed to meet the specific needs of different customer segments, ensuring scalability and flexibility.
1. Free Data Analytics Tier
Target Audience:
Individuals, startups, or small businesses exploring basic data analytics capabilities.
Features:
Data Visualization: Basic charts and graphs.
Data Storage: Limited storage (e.g., 1 GB).
Data Sources: Integration with 1-2 data sources (e.g., Excel, Google Sheets).
Reporting: Basic pre-built reports.
Support: Community forums and self-help documentation.
Pricing:
Free (no cost).
Purpose:
Attract users to the platform and encourage them to upgrade to paid tiers.
2. Starter Data Analytics Tier
Target Audience:
Small businesses or teams needing basic analytics tools.
Features:
Data Visualization: Advanced charts and dashboards.
Data Storage: Moderate storage (e.g., 10 GB).
Data Sources: Integration with 5-10 data sources (e.g., SQL databases, APIs).
Reporting: Customizable reports.
Collaboration: Basic team collaboration features.
Support: Email support with a 48-hour response time.
Pricing:
50 a month or 500 a year.
Purpose:
Provide an affordable entry point for small businesses to start using analytics tools.
3. Professional Data Analytics Tier
Target Audience:
Mid-sized businesses or departments requiring advanced analytics capabilities.
Features:
Data Visualization: Interactive dashboards and advanced visualizations.
Data Storage: Higher storage (e.g., 50 GB).
Data Sources: Integration with 20+ data sources.
Reporting: Advanced reporting with scheduling and exporting.
Collaboration: Enhanced team collaboration with role-based access.
Analytics Features: Predictive analytics and basic machine learning models.
Support: Priority email and chat support with a 24-hour response time.
Pricing:
200 a month or 2,000 a year.
Purpose:
Cater to growing businesses that need more robust analytics tools and collaboration features.
4. Business Data Analytics Tier
Target Audience:
Larger businesses or enterprises requiring comprehensive analytics solutions.
Features:
Data Visualization: Customizable dashboards and advanced visualizations.
Data Storage: High storage (e.g., 200 GB).
Data Sources: Integration with unlimited data sources.
Reporting: Advanced reporting with automated delivery.
Collaboration: Enterprise-grade collaboration with advanced user management.
Analytics Features: Advanced predictive analytics, machine learning, and AI-driven insights.
Security: Enhanced security features (e.g., encryption, audit logs).
Support: Dedicated account manager and 24/7 support.
Pricing:
500 a month or 5,000 a year.
Purpose:
Serve larger organizations with complex analytics needs and higher security requirements.
5. Enterprise Data Analytics Tier
Target Audience:
Large enterprises with custom requirements and high data volumes.
Features:
Data Visualization: Fully customizable dashboards and visualizations.
Data Storage: Unlimited storage.
Data Sources: Integration with unlimited data sources and custom connectors.
Reporting: Enterprise-grade reporting with real-time analytics.
Collaboration: Advanced collaboration with single sign-on (SSO) and role-based access control.
Analytics Features: Advanced AI/ML models, natural language processing (NLP), and real-time analytics.
Security: Enterprise-grade security (e.g., SOC 2 compliance, data encryption).
Support: Dedicated customer success team, 24/7 priority support, and SLAs.
Pricing:
Custom pricing based on requirements (e.g., 10,000+/year).
Purpose:
Provide a fully customized solution for large enterprises with specific needs.
6. Premium Data Analytics Tier
Target Audience:
Ultra-large enterprises or government organizations with mission-critical analytics needs.
Features:
Data Visualization: Fully customizable, white-labeled dashboards and visualizations.
Data Storage: Unlimited storage with high-performance infrastructure.
Data Sources: Integration with unlimited data sources, custom connectors, and APIs.
Reporting: Real-time, enterprise-grade reporting with advanced analytics.
Collaboration: Advanced collaboration with SSO, role-based access, and custom permissions.
Analytics Features: Cutting-edge AI/ML models, NLP, real-time analytics, and custom algorithms.
Security: Highest level of security (e.g., GDPR compliance, HIPAA compliance).
Support: Dedicated customer success team, 24/7 premium support, and custom SLAs.
Customization: Fully customizable platform with dedicated engineering support.
Pricing:
Custom pricing (e.g., $50,000+/year).
Purpose:
Serve ultra-large organizations with mission-critical analytics needs and the highest security and customization requirements.
Key Considerations for the Subscription Model:
Scalability: Ensure each tier can scale with the customer’s growth.
Upsell Opportunities: Design tiers to encourage customers to upgrade as their needs grow.
Customer Segmentation: Tailor features and pricing to specific customer segments.
Value Proposition: Clearly communicate the value of each tier to justify the pricing.
Flexibility: Offer monthly and annual pricing options to accommodate different customer preferences.
This 6-tier subscription model provides a structured approach to serving a diverse customer base while maximizing revenue and customer satisfaction.

Scenario Analysis And Key Assumption Drivers For The Financial model
To build the financial model, you need to define key assumptions and drivers:
Revenue Growth Rate: Based on market size, customer acquisition, and pricing strategy.
Customer Acquisition Cost (CAC): Cost to acquire a new customer.
Churn Rate: Percentage of customers who cancel subscriptions.
Gross Margin: Based on COGS as a percentage of revenue.
Operating Expenses as % of Revenue: Typically higher in early stages due to R&D and marketing.
Capital Expenditures (CapEx): Investments in infrastructure and technology.
Working Capital: Assumptions for accounts receivable, accounts payable, and inventory (if applicable).
These data analytics financial models provide a comprehensive view of the data analytics company’s financial health and performance, enabling stakeholders to make informed decisions about growth, investment, and operations.
Download Link On Next Page