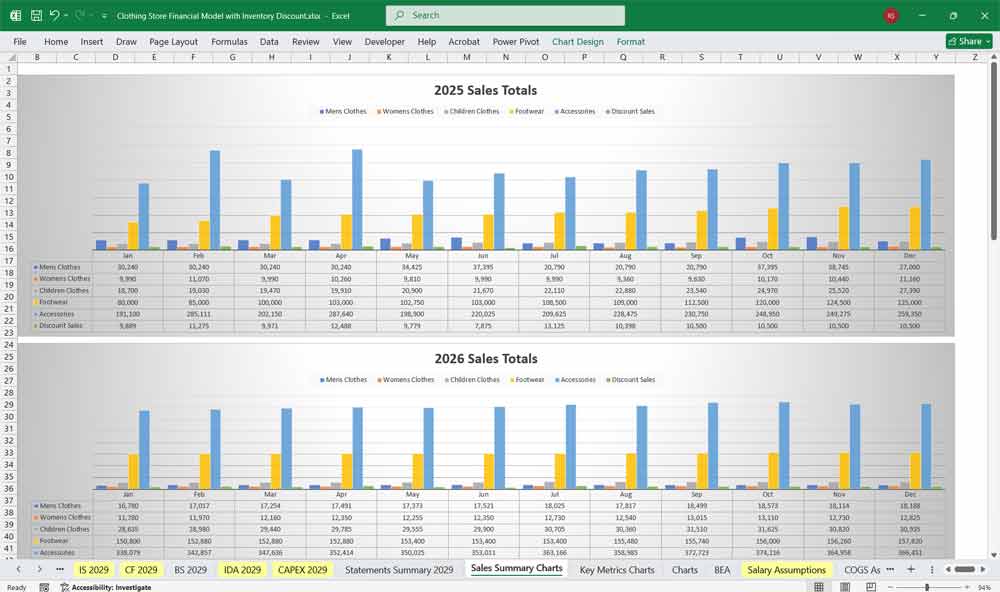
5-Year, 3-Statement Excel Clothing Store Financial Model with Inventory Discount Analysis includes revenue streams from Men’s Clothes, Women’s Clothes, Children’s Clothes, Footwear, Accessories, and Discount Sales Services, as well as cost structures and financial statements to forecast the financial health of your Clothing Store.
Financial Model for a Clothing Store
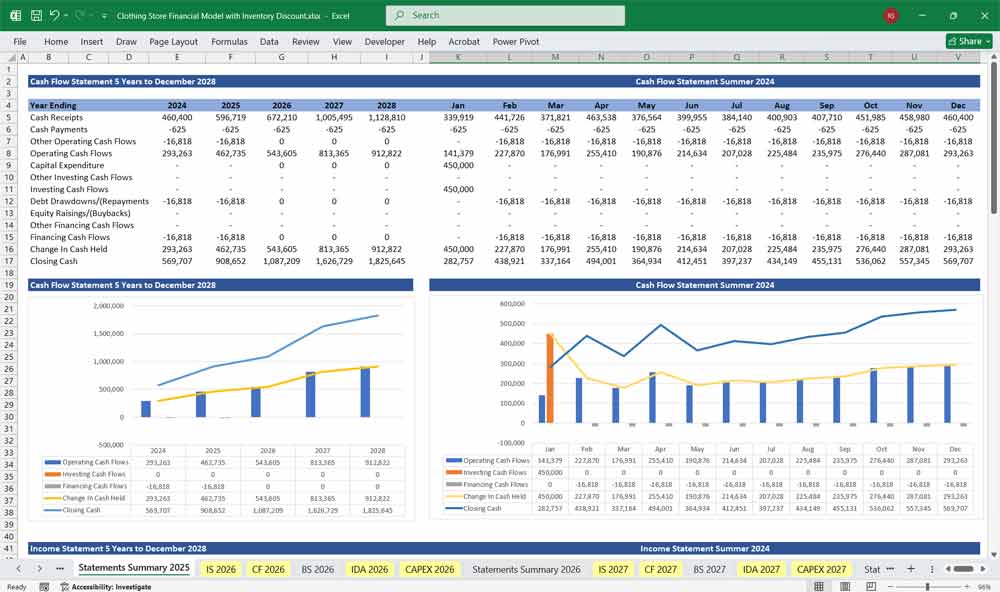
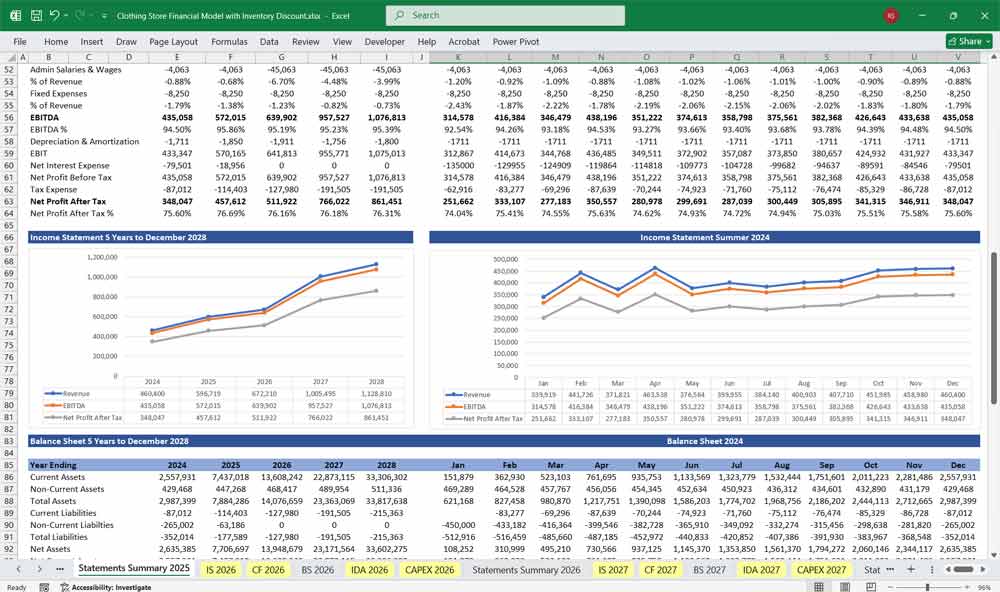
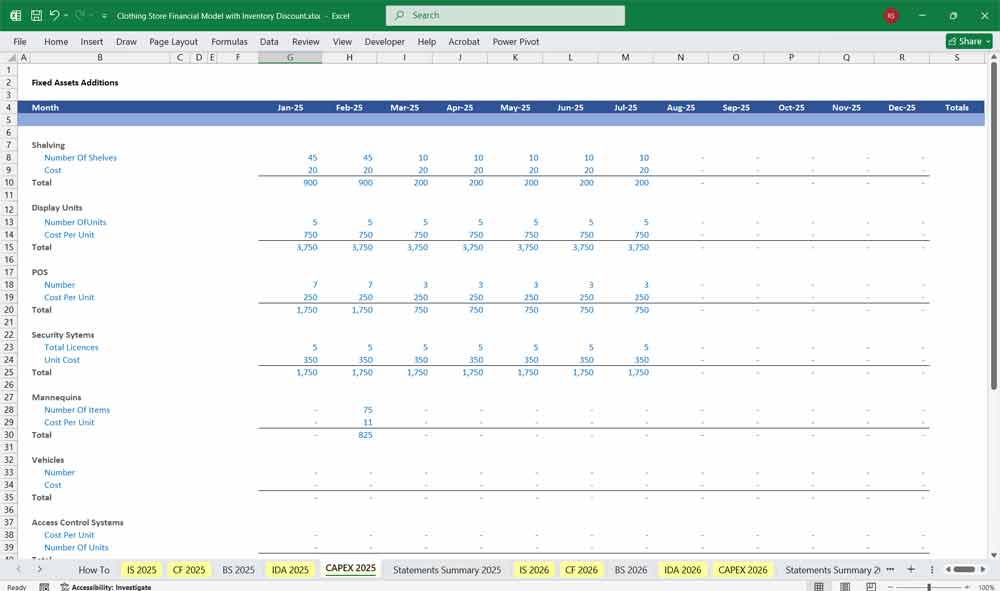
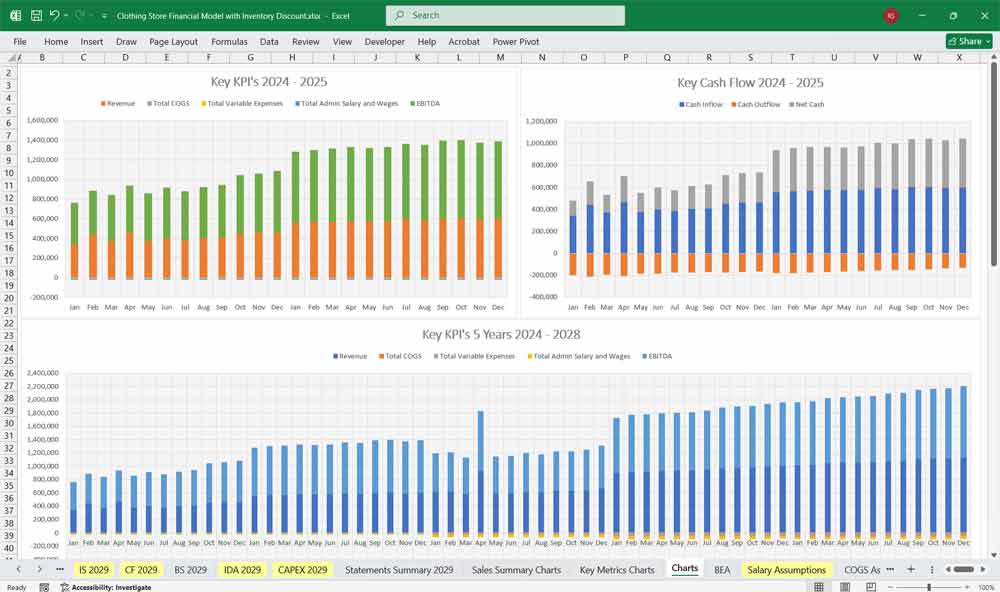
Financial model for a clothing store forecasting and tracking key financial metrics, inventory performance, and operating expenses over set monthly periods. Includes Income Statement, Cash Flow Statement, Balance Sheet, and Inventory Discount Analysis Sheets.
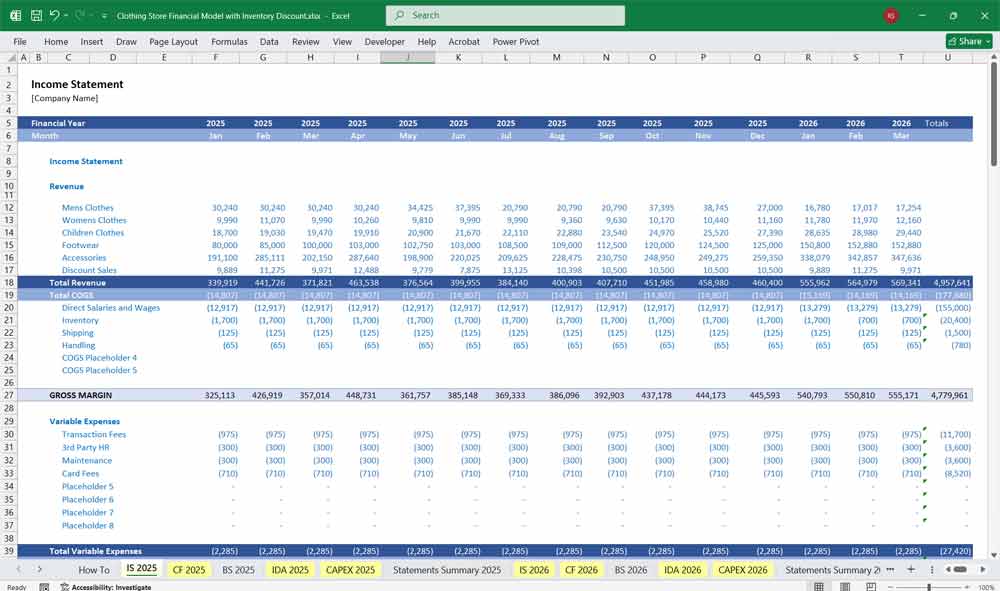
Income Statement (Profit & Loss Statement)
This statement summarizes the clothing store’s revenues, costs, and expenses over a period, showing profitability.
A. Revenue
Retail Sales Revenue
In-store sales
Online sales
Wholesale Revenue (if applicable)
Other Revenue
Tailoring services
Consignment sales
Gift card breakage
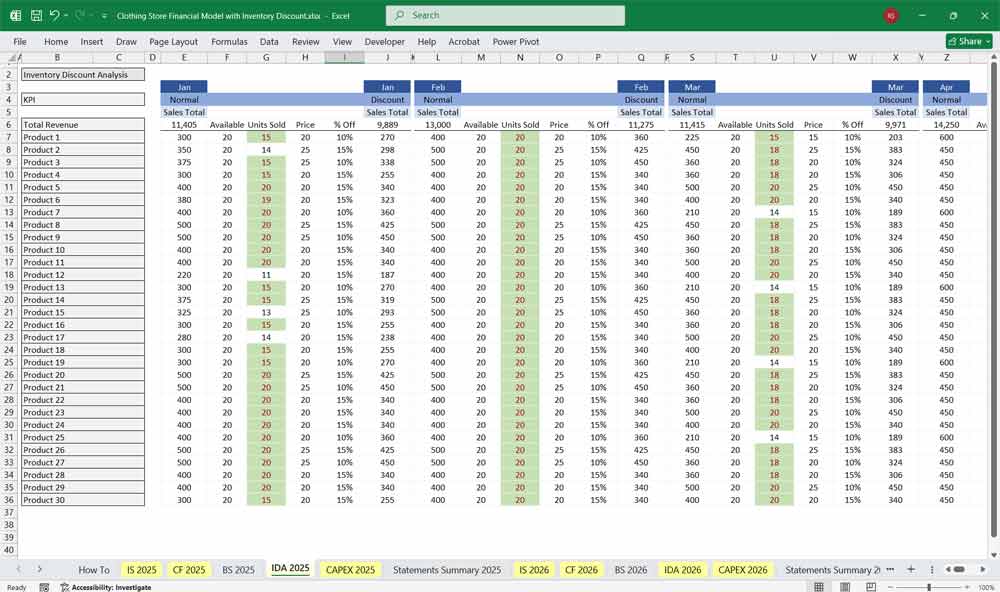
Revenue = Units Sold × Average Selling Price (ASP)
B. Cost of Goods Sold (COGS)
Opening Inventory
Purchases (including shipping and handling)
Closing Inventory
OR: Units Sold × Cost per Unit
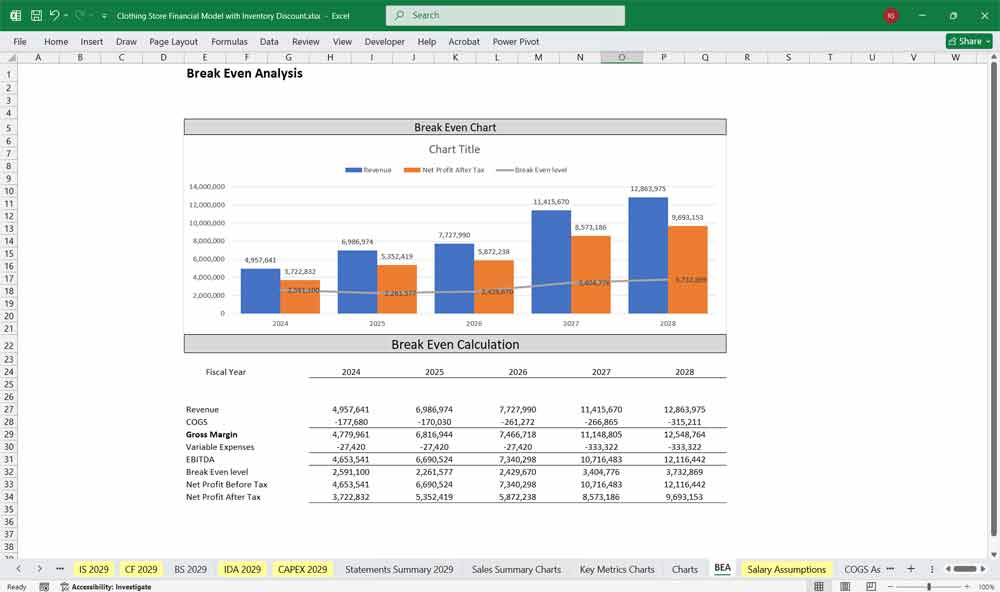
Gross Profit = Revenue – COGS
C. Operating Expenses
Rent and Utilities
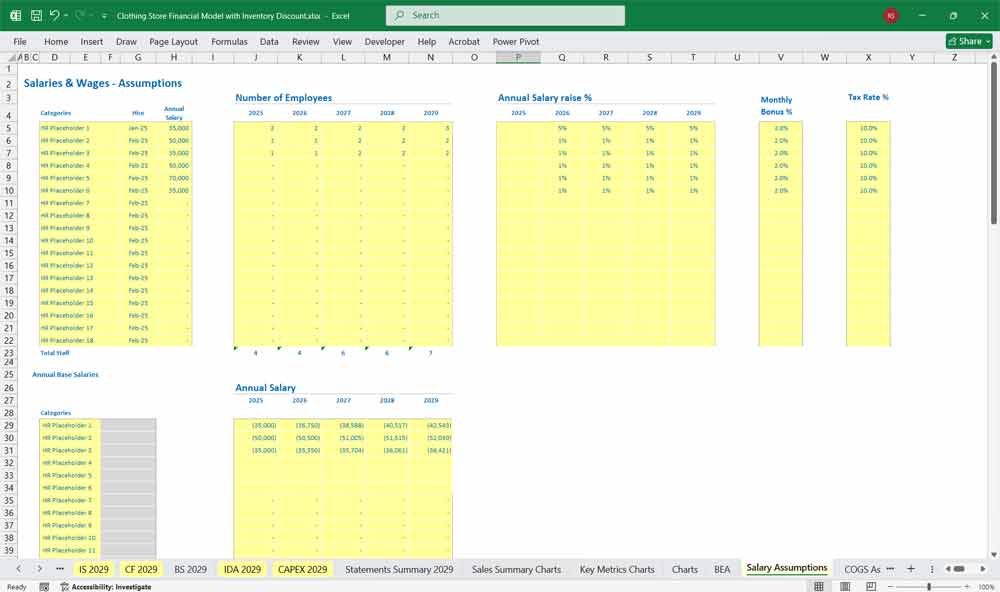
Salaries and Wages
Marketing and Advertising (social media, flyers, promotions)
Optimize markdown timing (e.g., start clearance at 25%, not 50%)
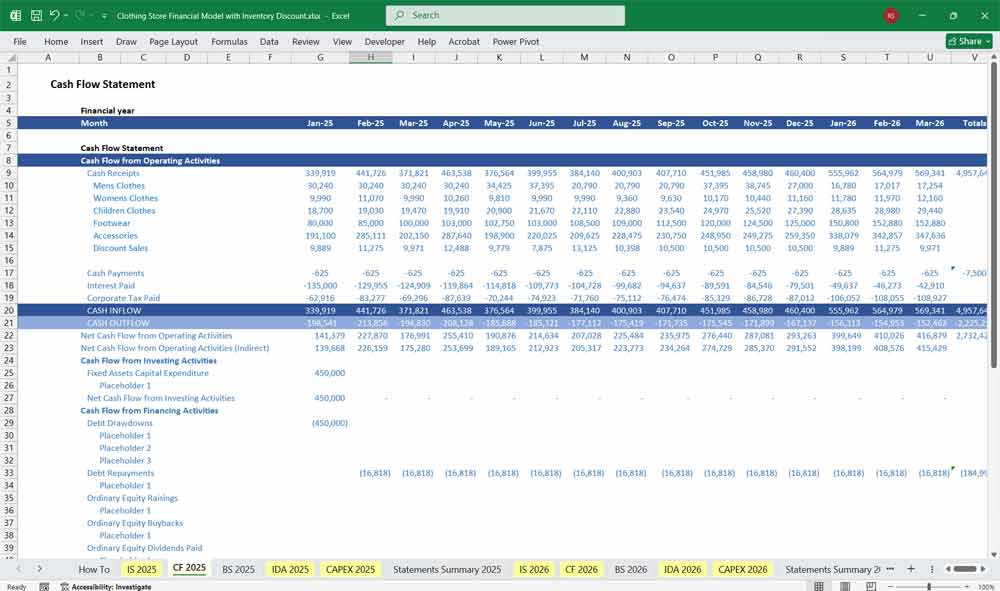
Integration of Sheets
Interlinked pages via formulas in Excel spreadsheets:
Sales data drives revenue and COGS in the Income Statement
Cash inflows/outflows in Cash Flow Statement come from operating, investing, and financing activities
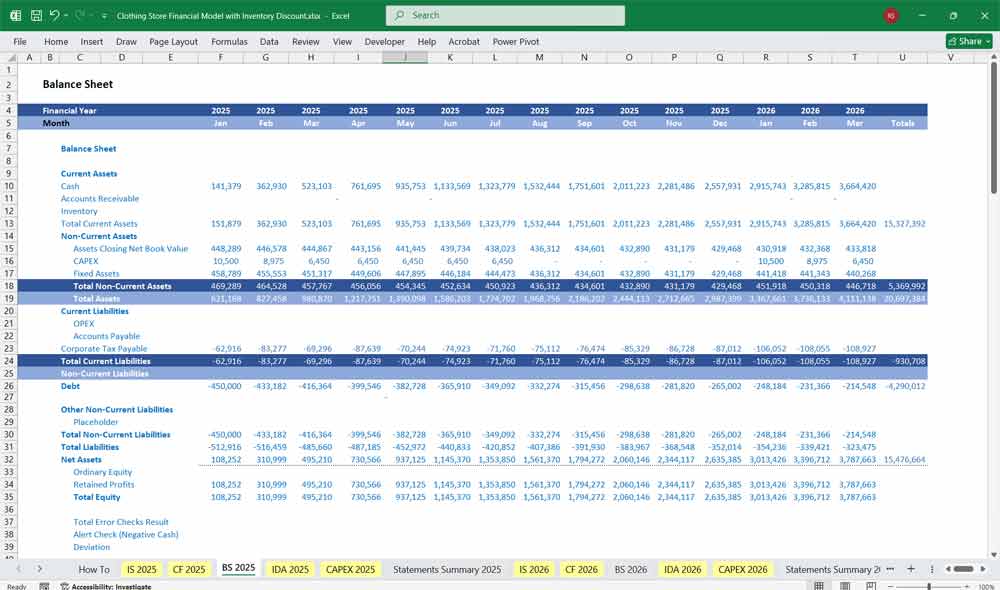
Closing balances of Cash, Inventory, and Payables feed into the Balance Sheet
Inventory Discount Analysis provides insights that influence purchasing, pricing, and discounting strategy, reflected in all other sheets.
Final Notes on the Financial Model
This 5 Year Clothing Store Financial Model must focus on balancing capital expenditures with steady revenue growth from diversified services. By optimizing operational costs, power efficiency, and maximizing high-margin services the model ensures sustainable profitability and cash flow stability.