
Affiliate Marketing Financial Model
This 5-Year, 3-Statement Excel Affiliate Marketing Financial Model includes revenue streams from Pay-per-sale (PPS) to Pay-per-click (PPC). Cost structures and financial statements to forecast the financial health of your Agency. User Guide.
Financial Model for an Affiliate Marketing Agency
Comprehensive 5 Year Affililiate Model involves detailed revenue projections, cost structures, capital expenditures, and financing needs. This model provides a thorough understanding of the financial viability, profitability, and cash flow position of an Affiliate marketer.
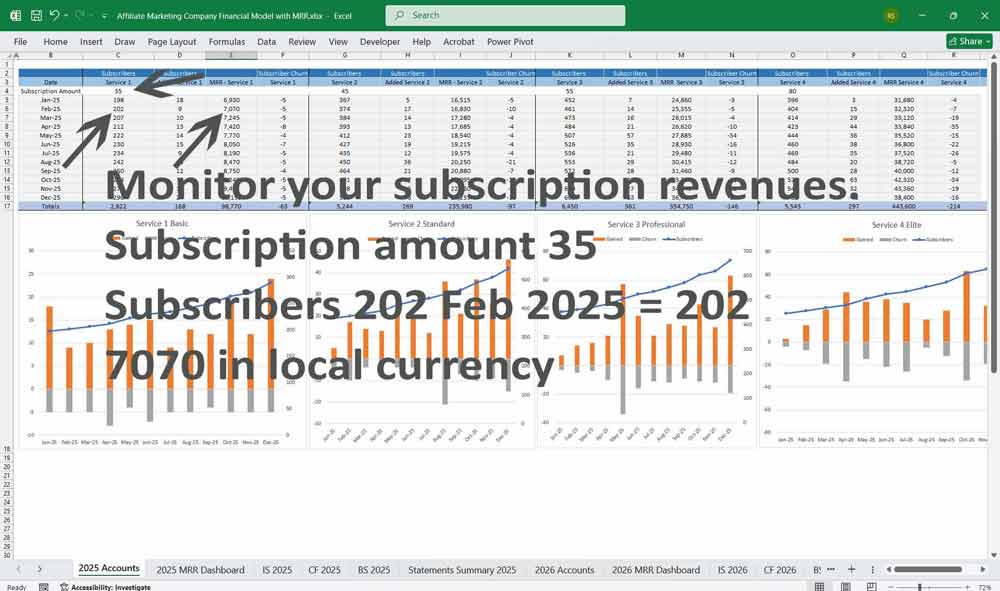
This model has inputs for both 5 PAYG revenue streams and 6-Tiered subscriptions
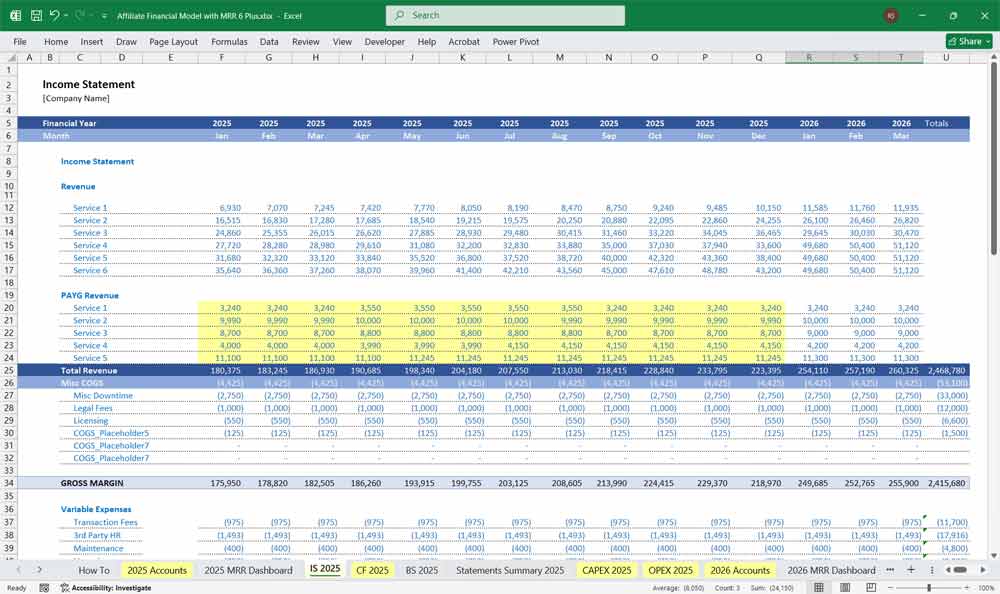
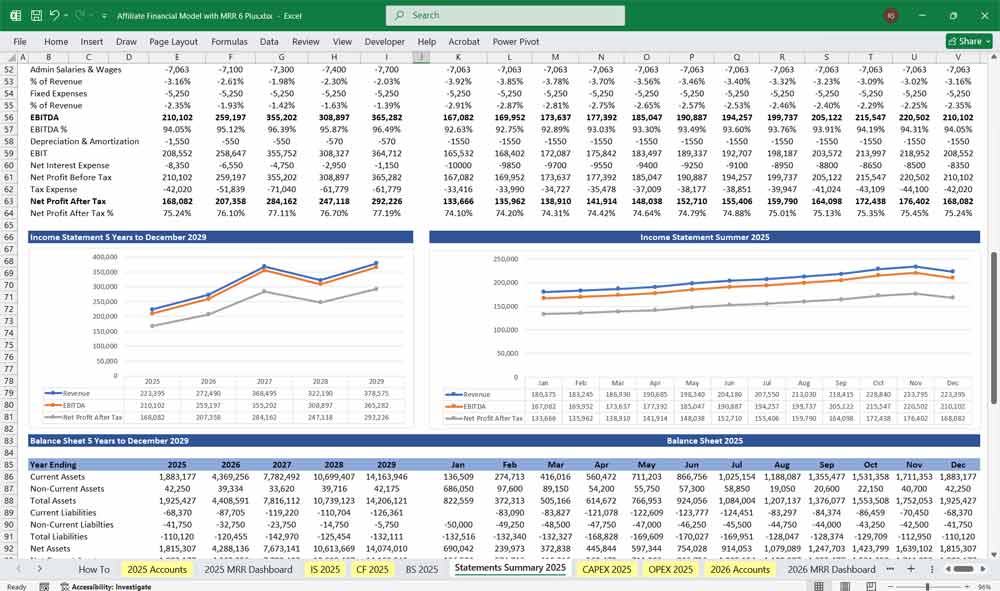
Income Statement (P&L)
The income statement shows profitability by tracking revenue sources, cost of sales, operating expenses, and net income.
Revenue Streams
Affiliate revenue depends on agreements with advertisers/merchants. Key models:
Pay-per-sale (PPS): Agency earns a commission (%) on each product/service sold through affiliate links.
Pay-per-action (PPA/CPA): Agency earns when a user completes a specific action (sign-up, free trial, form fill).
Pay-per-lead (PPL): Agency earns for each qualified lead generated.
Pay-per-click (PPC): Agency earns when users click ads or links, regardless of purchase.
Pay-per-view (PPV): Agency earns from impressions (mainly display/video ads).
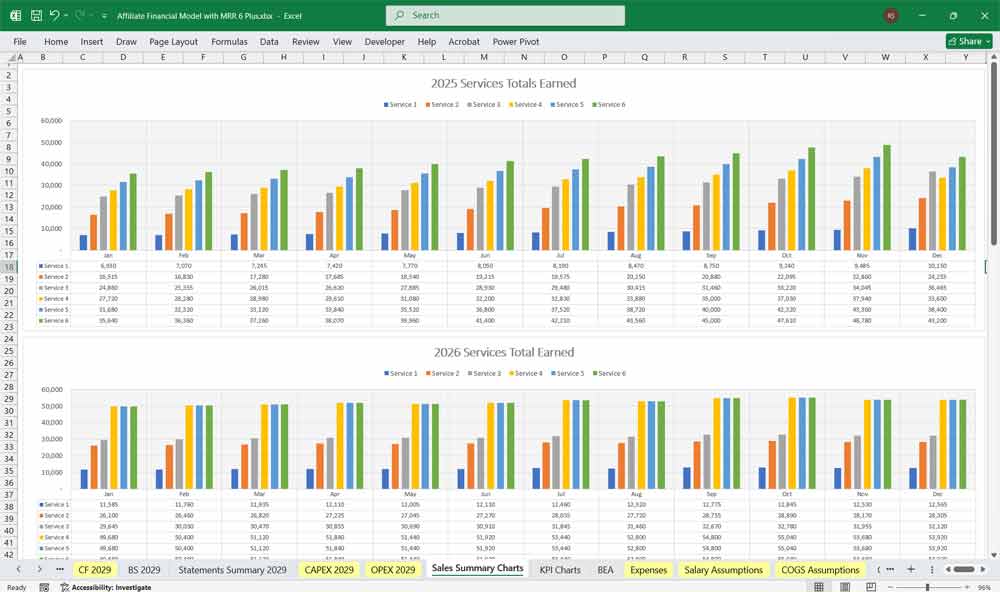
Revenue Projections (example):
PPS: $500,000 (higher margins but depends on conversion rates).
CPA/PPA: $300,000 (moderate volume, predictable payouts).
PPL: $200,000 (depends on lead validation).
PPC: $150,000 (high traffic, low payout per click).
PPV: $50,000 (lowest payout, but adds volume).
Total Revenue: $1.2M
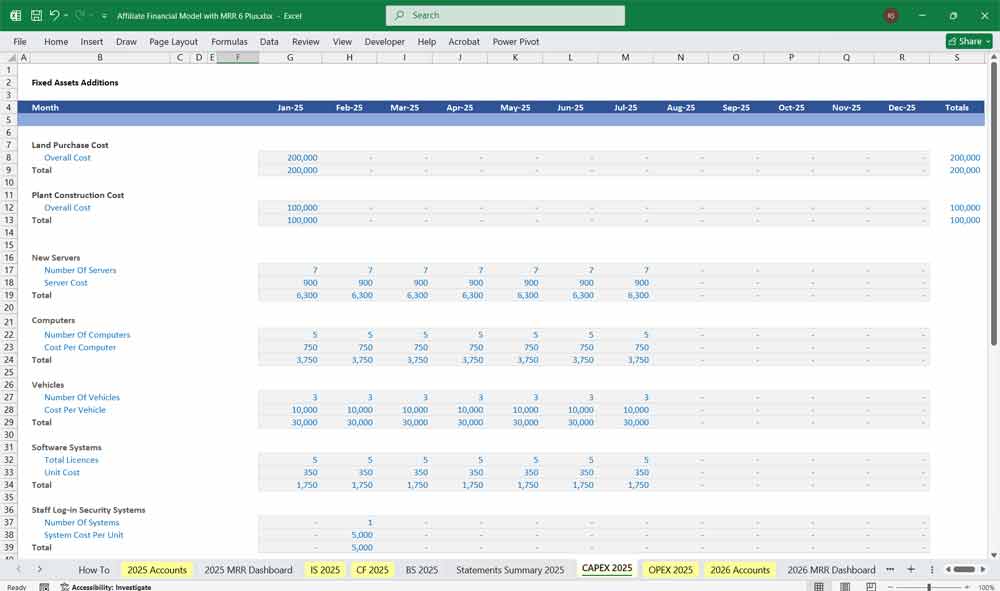
Cost of Goods Sold (COGS)
Direct costs to generate revenue:
Affiliate platform/technology fees (tracking, attribution tools).
Traffic acquisition (paid ads, SEO tools, influencer partnerships).
Content creation (blogs, videos, copywriting).
Example: $300,000
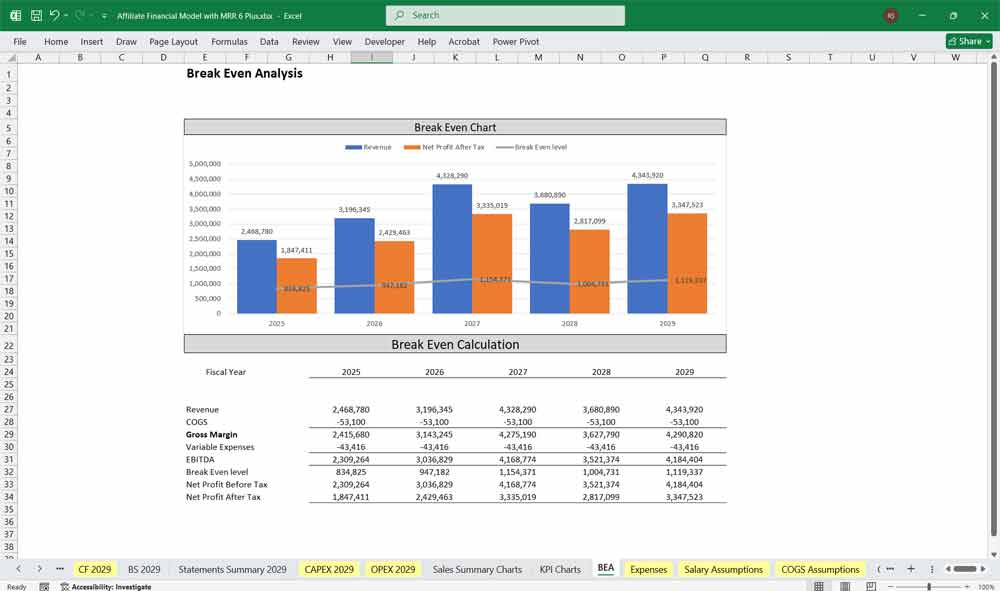
Gross Profit
= Revenue – COGS = $900,000
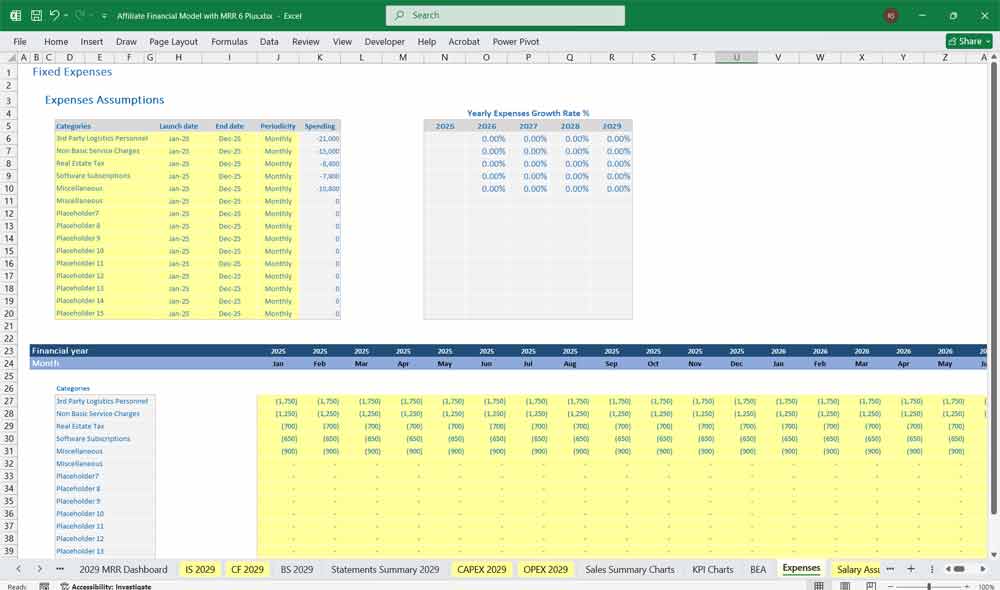
Operating Expenses
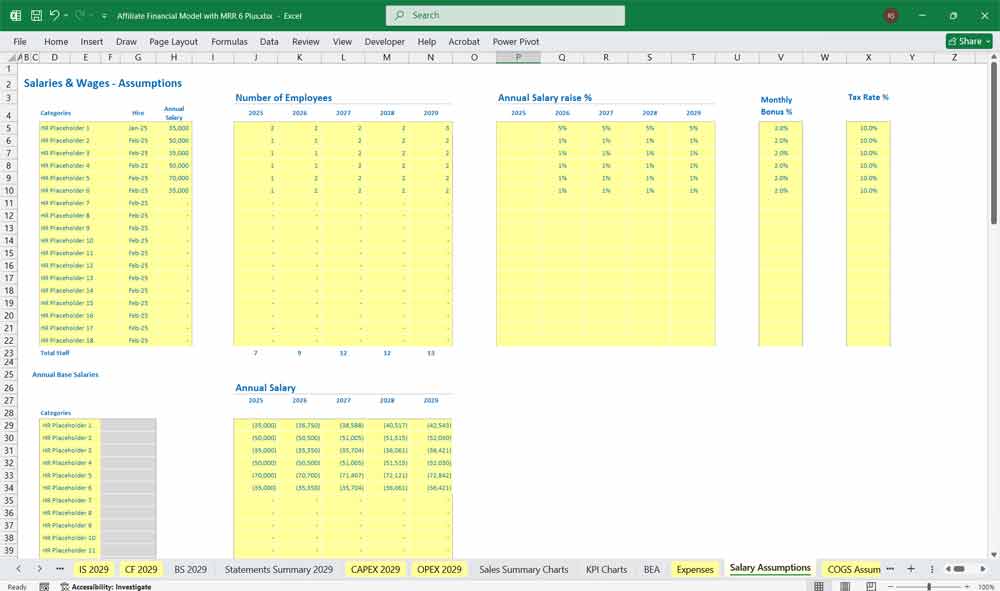
Salaries & wages (affiliate managers, marketers, developers).
Marketing & promotion (beyond direct traffic acquisition).
Software subscriptions (analytics, CRM, AI tools).
General & administrative (rent, legal, accounting).
Example: $400,000
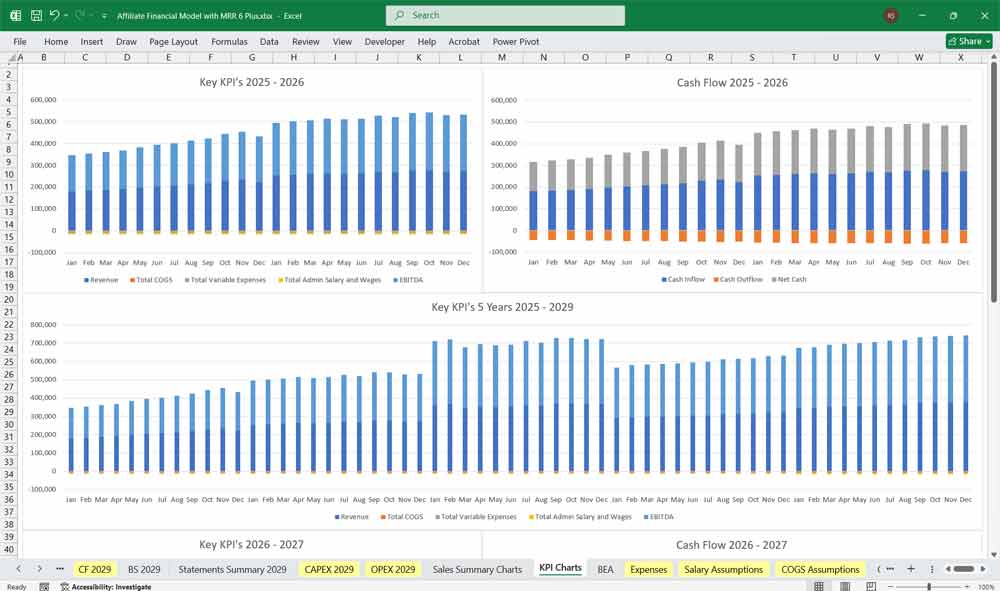
EBITDA
= Gross Profit – Opex = $500,000
Depreciation & Amortization
For capitalized software or equipment. Example: $20,000
Operating Income (EBIT)
= $480,000
Interest Expense
If loans are used for scaling. Example: $30,000
Taxes (assume 25%)
= $112,500
Net Income
= $337,500
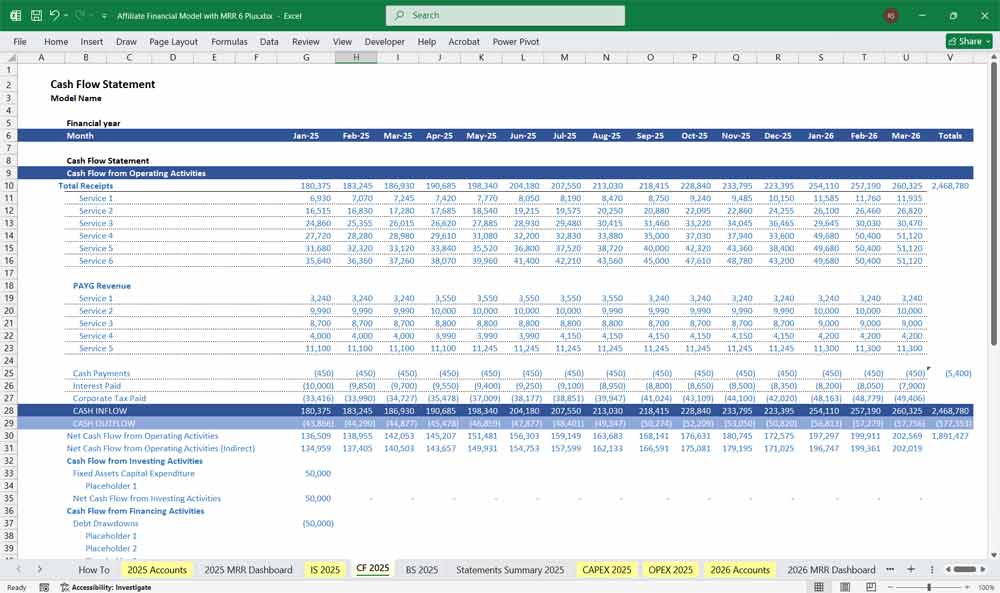
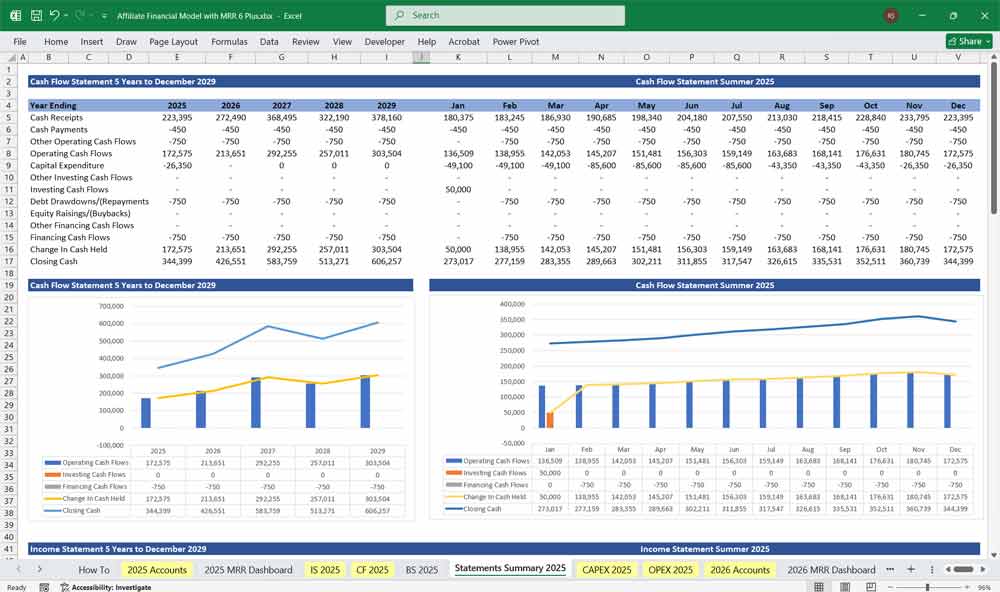
Affiliate Marketing Agency Cash Flow Statement
Example of how cash flows into and out of the agency.
Operating Activities
Net income: $337,500
Add back non-cash expenses: +$20,000 (depreciation)
Adjust for working capital:
Accounts receivable (delays in payments from networks/advertisers). Example: –$50,000
Accounts payable (delays in paying ad networks/freelancers). Example: +$30,000
Net Cash from Operating Activities: $337,500 + 20,000 – 50,000 + 30,000 = $337,500
Investing Activities
Purchase of software tools/servers: –$40,000
Investment in content assets: –$20,000
Net Cash from Investing Activities: –$60,000
Financing Activities
Loan proceeds: +$100,000
Loan repayments: –$50,000
Equity investment (if applicable): +$200,000
Net Cash from Financing Activities: +$250,000
Net Change in Cash
= $337,500 – $60,000 + $250,000 = $527,500
Ending Cash Balance
= Beginning cash ($200,000) + Net Change ($527,500) = $727,500
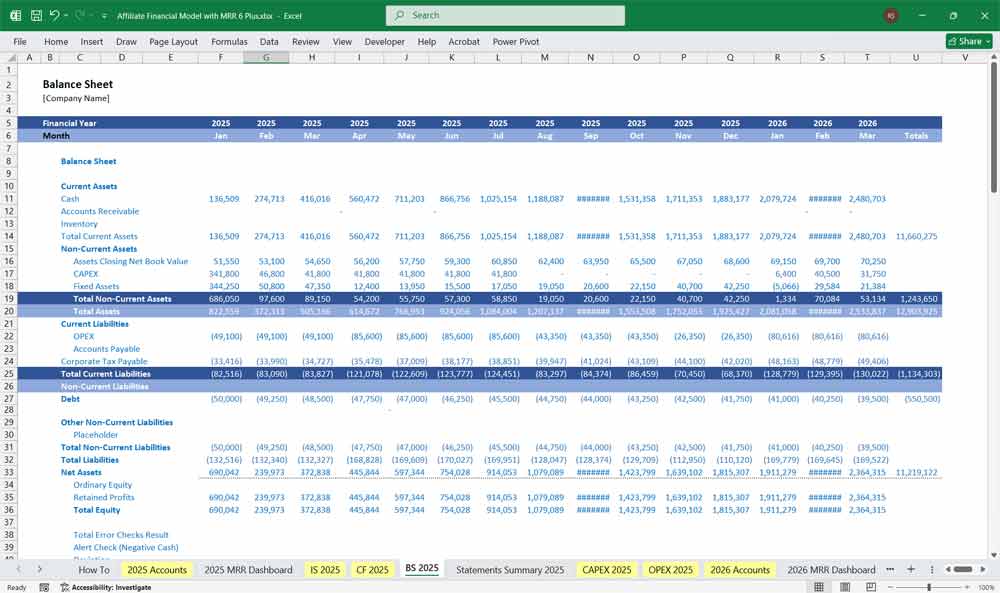
Affiliate Marketing Agency Balance Sheet
Example snapshot of financial health at period end.
Assets
Current Assets:
Cash: $727,500
Accounts receivable (advertiser payouts pending): $150,000
Prepaid expenses (software, hosting): $20,000
Total Current Assets: $897,500
Non-Current Assets:
Software & tools (capitalized): $100,000
Equipment: $50,000
Intangibles (brand value, content library): $30,000
Total Non-Current Assets: $180,000
Total Assets: $1,077,500
Liabilities
Current Liabilities:
Accounts payable (vendors, ad networks): $80,000
Accrued expenses (salaries, taxes): $40,000
Total Current Liabilities: $120,000
Long-Term Liabilities:
Bank loan: $200,000
Total Liabilities: $320,000
Equity
Owner’s equity: $500,000
Retained earnings: $257,500
Total Equity: $757,500
Total Liabilities & Equity: $1,077,500
Key Takeaways
PPS & CPA drive most profitability (higher payouts but depend on conversions).
PPC & PPV provide volume but lower margins (rely heavily on traffic).
Cash flow is lumpy because advertisers often delay payments, while the agency pays upfront for traffic.
Scaling requires balancing traffic acquisition costs vs payout cycles.
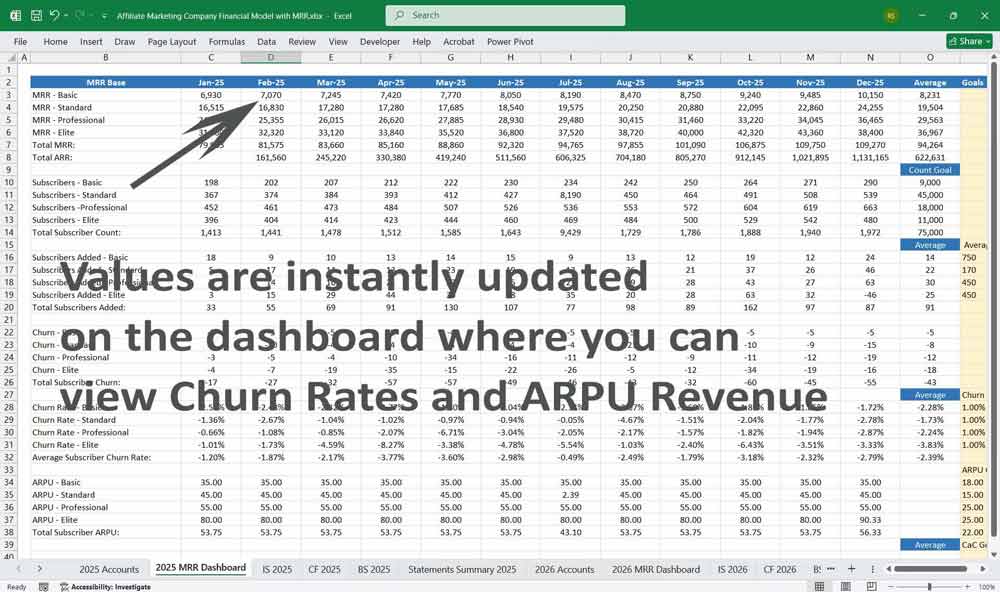
Key Financial Metrics for an Affiliate Marketer
Revenue Metrics
Pay-per-sale (PPS) In An Affiliate Marketing Financial Model Environment
In a financial model, PPS revenue is calculated as the number of sales generated multiplied by the commission per sale. Since PPS payouts are typically higher than other models (like PPC or PPV), this stream often forms the largest portion of affiliate revenue. However, it depends heavily on conversion rates and product pricing, making sales forecasting and accurate traffic-to-sale assumptions critical for reliable revenue projections.
Affiliate Marketing Financial KPIs And Pay-per-action (PPA/CPA)
In a financial model, key KPIs for CPA include conversion rate (actions ÷ clicks), cost per acquisition (marketing spend ÷ actions), and effective payout per action. These KPIs help measure campaign efficiency, track profitability, and forecast revenue, since small changes in conversion or payout rates can significantly impact overall financial performance.
The connection between Pay-per-lead (PPL) Affiliate Marketing and A Financial Model
In a financial model, PPL revenue is forecasted by multiplying the number of validated leads by the agreed payout per lead. Since lead quality can vary, KPIs like lead-to-sale conversion rate, cost per lead (CPL), and lead validation rate are critical for accurate projections. This connection ensures the financial model not only estimates top-line revenue but also accounts for the effectiveness and profitability of lead-generation campaigns.
Pay-per-click (PPC) And Affiliate Marketing
In a financial model, PPC revenue is projected by multiplying the number of clicks by the payout per click, making traffic volume and click-through rates the primary drivers. Since payouts per click are relatively low, profitability depends on scaling large volumes of quality traffic while keeping acquisition costs (ad spend, SEO, content creation) under control. Modeling PPC requires close tracking of cost per click (CPC), click-through rate (CTR), and return on ad spend (ROAS) to forecast sustainable margins.
Affiliate Marketers And PPV Revenue
PPV does not require clicks, leads, or purchases, making revenue primarily dependent on traffic volume and ad visibility. In a financial model, PPV revenue can be calculated as a number of impressions multiplied by the payout per thousand views (CPM). Since payouts per view are typically very low, success relies on generating massive traffic at minimal cost, with KPIs like impressions, CPM rates, and effective cost per mille (eCPM) being central to forecasting revenue and profitability.
Final Notes on the Financial Model
This 5-Year Affiliate Marketing Financial Model must focus on balancing capital expenditures with steady revenue growth from diversified PAYG and subscription-based services. By optimizing operational costs, and power efficiency, and maximizing high-margin services, the model ensures sustainable profitability and cash flow stability.
Download Link On Next Page